Russell 2000 Forecast This Week — Outlook, Drivers & Key Levels
This week's Russell 2000 outlook: key drivers, volatility context, risk-opportunity assessment and the week ahead.

Where Things Stand
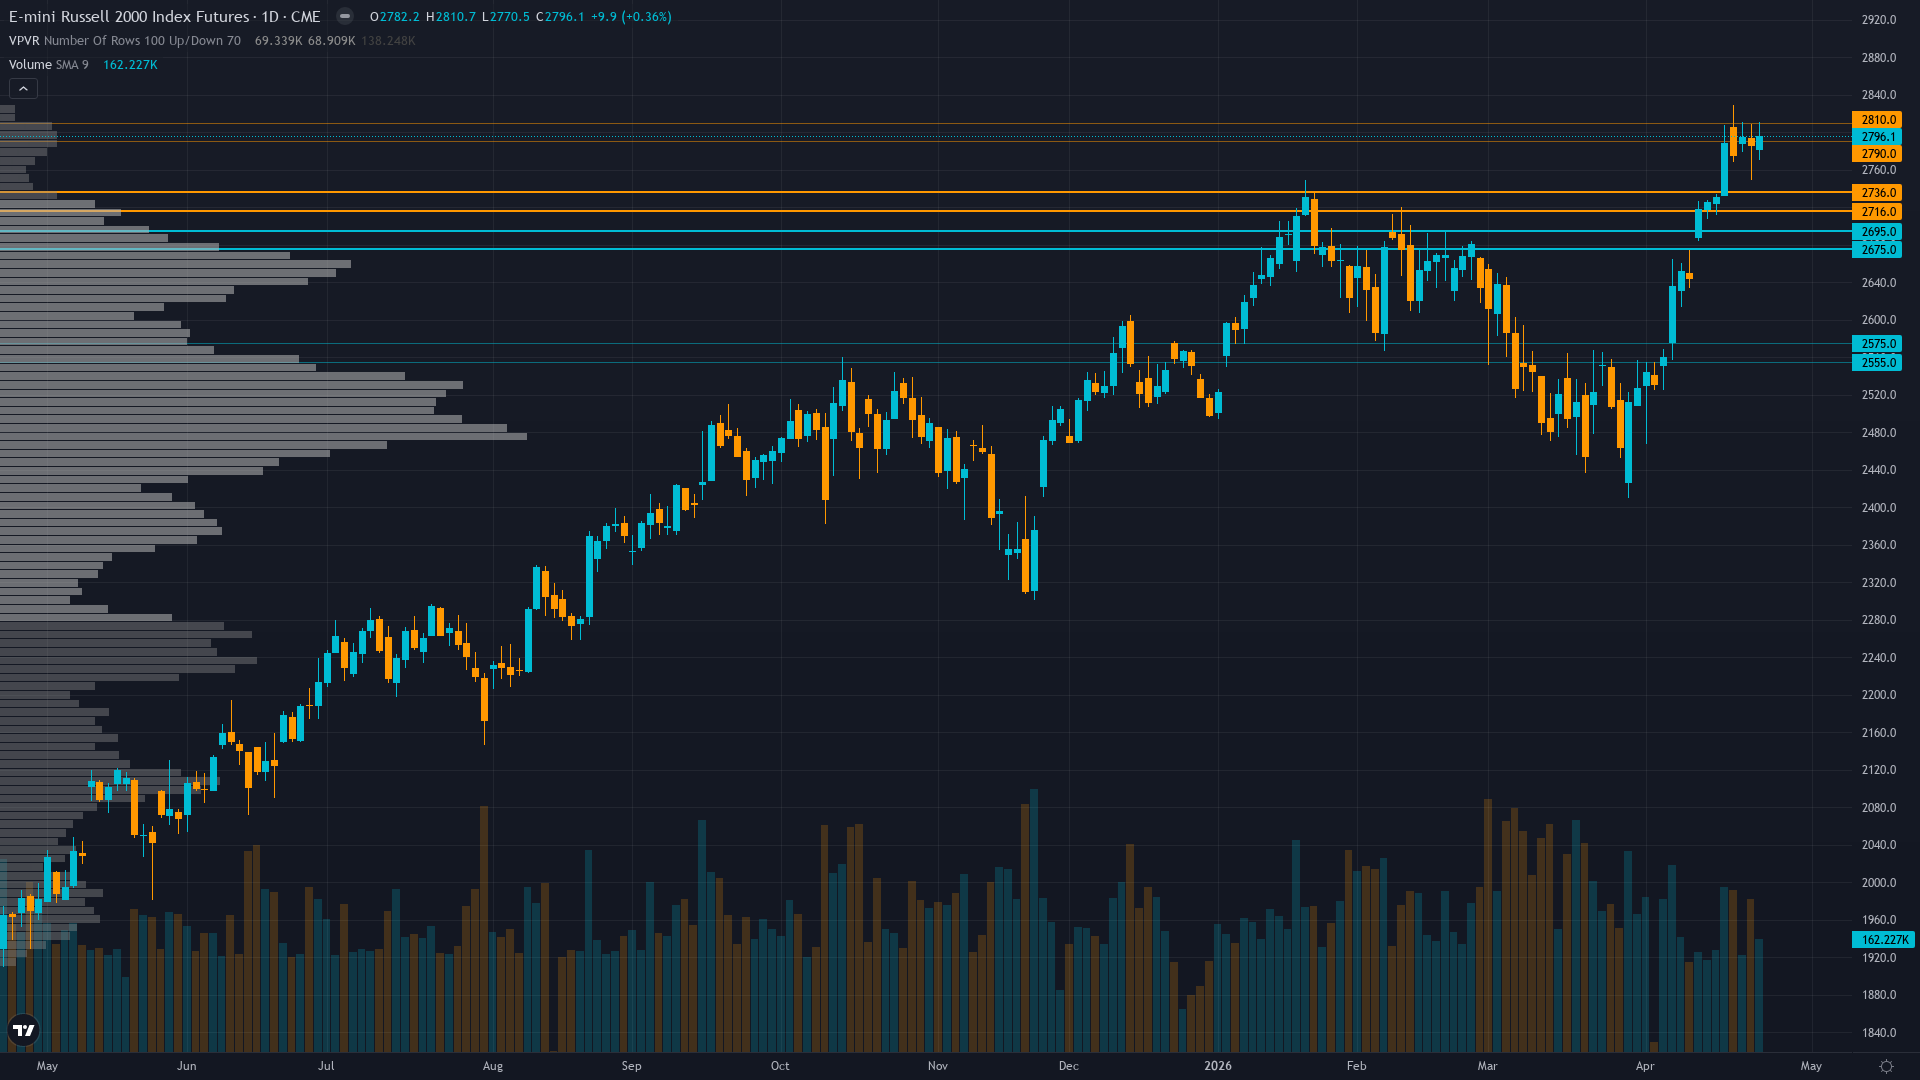
Russell 2000 holds at 2798.8, up a marginal 0.15% as the market grinds forward. Russell 2000 futures is in a breaking out market state, requiring careful assessment of current conditions.
Small-caps celebrating new all-time highs with 'Great Rotation' narrative gaining mainstream traction, Q1 earnings season providing validation catalyst, bullish positioning dominant
What's Driving Price
Primary driver: MANDATORY BIAS REVIEW TRIGGERED: Four consecutive BULLISH weeks with 4 consecutive CORRECT calls totaling 14.4% cumulative gain now confronting extreme sentiment complacency (VIX 19.50, put/call 0.51) and contrarian bearish setup as crowd positioning reaches greed extremes
Secondary factor: New all-time high above 2,798 established on April 26 (today) exceeding prior April 17 ATH of 2,797.1, technically validating breakout structure but occurring amid dangerous sentiment extremes and FOMC uncertainty 3 days away
Additional influence: Technical agent shows BEARISH signal -2 with confirmed downtrend below 50/200-day MAs and RSI 33.7 oversold, directly contradicting new ATH price action and creating severe discipline conflict requiring conviction reduction
Economic backdrop: Fed on hold at 3.50-3.75% with April 28-29 FOMC meeting 2 days away creating binary event risk, rate cut expectations pushed to December 2026 removing near-term easing catalyst
Fundamental assessment: Q1 2026 earnings season underway with 44.9% YoY growth consensus creating fundamental validation opportunity, but elevated 25.39x forward P/E creates vulnerability to disappointment
Chart Assessment
New ATH above 2,798 breaks April 17 peak but Technical agent shows downtrend with RSI 33.7 oversold—severe analytical contradiction suggesting data lag or index vs futures divergence
Trend strength registers 8/10 — a reading that suggests the directional impulse has real staying power.
Risk & Opportunity
Primary risk: Mean reversion from extreme sentiment complacency (VIX 19.50, put/call 0.51, AAII bulls 46% above historical average) combining with FOMC hawkish surprise triggering 5-8% correction toward 2,650-2,700 support (Probability: medium)
Primary opportunity: Continued earnings-driven rally if Q1 results validate 44.9% growth consensus and FOMC provides dovish relief, targeting 2,850-2,900 measured extension from multi-year breakout pattern (Timeframe: 2-4 weeks through Q1 earnings season validation)
This week's edge: Market consensus celebrating new ATH may be severely underpricing sentiment complacency risk at VIX 19.50 and put/call 0.51 extremes while overweighting earnings optimism on elevated 44.9% bar, creating contrarian opportunity to fade strength into FOMC uncertainty rather than chase extended rally after 14.4% four-week gain—desk assessment is NEUTRAL after mandatory bias review identifies thesis staleness and discipline conflicts requiring conviction reset
Volatility Backdrop
RTY futures volatility at the 58th percentile reflects a balanced environment where standard risk parameters apply. Volatility remains anchored at current levels, with no clear signal of an imminent regime shift in either direction.
Normal volatility regime at 58th percentile supports standard risk management with 3-4% stops below 2,700 support, expect 40-60 point daily ranges, stable pattern suggests directional environment but FOMC creates binary spike risk
Historical Seasonal Bias
Seasonal analysis shows a historically bullish bias for small-cap futures in April 2026, with a 60% win rate. Q2 start often sees risk-on rotation.
What to Watch
The FOMC Meeting April 28-29 with forward guidance critical for rate-sensitive small-caps, 92%+ market expectation of hold but any hawkish surprise could trigger correction on Tuesday 28 April stands as the week's primary risk event — high-impact and capable of overriding the existing technical and sentiment setup.
The interplay between breaking out market conditions and upcoming catalysts will define this week's trading landscape for Russell index.
This analysis covers one dimension. Our full weekly report combines six specialist agents into a single actionable briefing with directional bias, key levels, and risk-opportunity matrix.
Start Free — Get the Market of the WeekFree weekly report · No credit card · Upgrade anytime


