Russell 2000 COT & Institutional Positioning — Smart Money Analysis
Russell 2000 institutional positioning: COT data, sentiment analysis and smart money flow assessment.

Where Institutions Stand
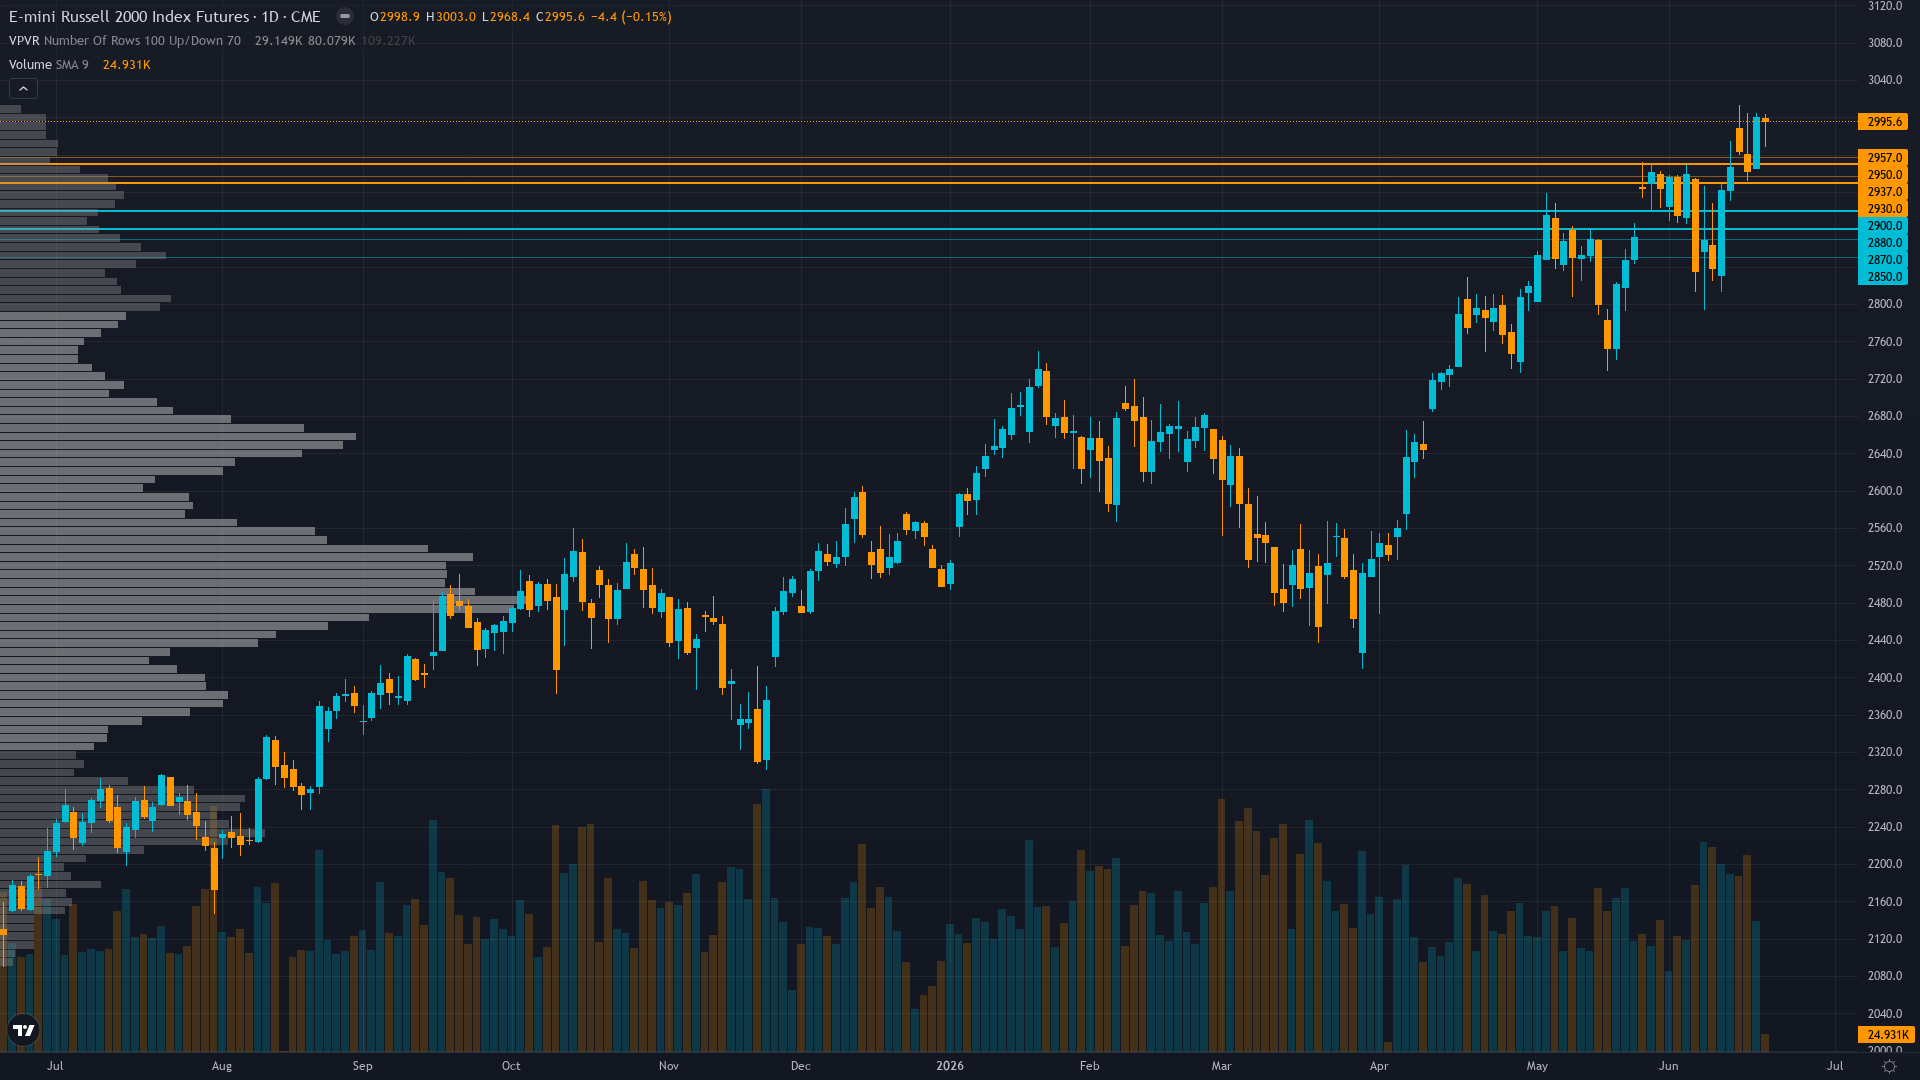
Russell 2000 holds at 2995.6, off 0.15% in a modest retracement from recent levels.
Approaching June 26 reconstitution effective date creates forced passive rebalancing flows with $11 trillion benchmarked to Russell indices, though IWM outflows of -4.10B over 1-year period and stale February COT data limit real-time positioning visibility on whether institutional smart money is accumulating or distributing into this event
Consensus vs MAD View
Market consensus: Small-caps consolidating near June 15 all-time high at 3002 with market positioned for June 26 Russell reconstitution to provide technical support through forced passive rebalancing flows, though June 17 Fed hawkish pivot removing easing narrative creates fresh uncertainty
Primary driver: Post-input development identified: Fed Chair Kevin Warsh's June 17 FOMC meeting delivered hawkish pivot removing forward guidance language, with dot plot shift showing 9 of 18 officials now pointing toward potential 2026 rate hike versus only 1 seeing cut, materially changing policy trajectory for rate-sensitive small-caps
Where the Crowd May Be Wrong
Desk mildly bullish at conviction 5 on reconstitution flows while acknowledging June 17 Fed hawkish pivot creates uncertainty broadly aligns with market's mixed positioning (Fear & Greed 37 Fear, put/call 0.59 complacent), creating low-to-moderate divergence as both desk and consensus recognize tension between mechanical catalyst support and fundamental repricing from Fed shift
Crowd Psychology
Neither side has committed heavily to Russell 2000 futures, leaving sentiment in a neutral zone that offers little directional guidance on its own.
Options Flow
VIX at 16.78 well below 20 threshold with equity put/call at 0.59 showing complacent positioning and minimal defensive hedging despite consolidation near all-time highs, RVX last reported 25.96 on June 11 indicates small-cap specific fear premium but overall options market signals bullish lean without panic protection
The Bottom Line on Positioning
The positioning mosaic for Russell index combines neutral sentiment with stable volatility conditions. Trend strength registers at 6/10, suggesting meaningful but not extreme directional bias. Taken together, institutional behaviour, crowd psychology, and derivatives data frame the setup heading into the new week.
This analysis covers one dimension. Our full weekly report combines six specialist agents into a single actionable briefing with directional bias, key levels, and risk-opportunity matrix.
Start Free — Get the Market of the WeekFree weekly report · No credit card · Upgrade anytime


