Platinum Forecast This Week — Outlook, Drivers & Key Levels
This week's Platinum outlook: key drivers, volatility context, risk-opportunity assessment and the week ahead.

Current Market Picture
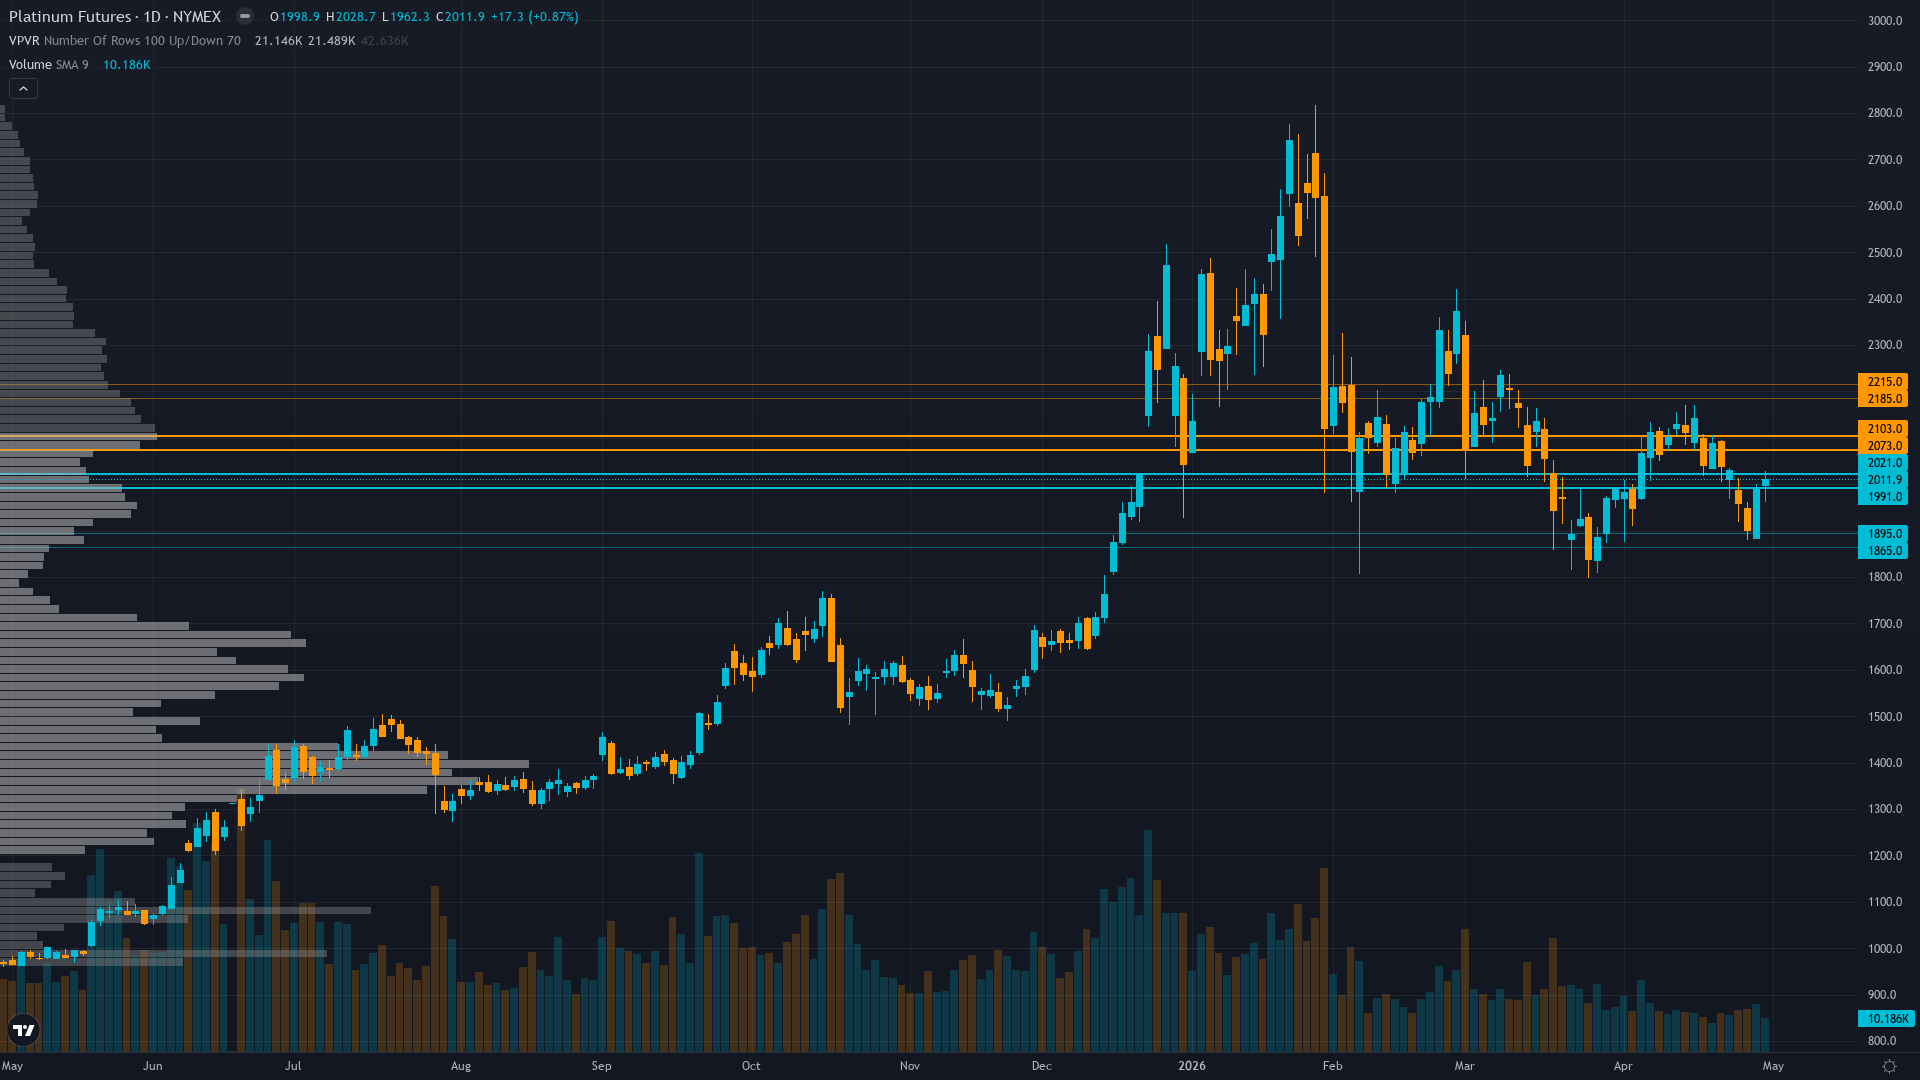
platinum is trading at 2004.65, up a modest 0.44% as the market edges higher. The market in platinum futures is coiling, with narrowing price ranges suggesting stored energy that will eventually release.
Market digesting 31% correction from January parabolic peak with tactical consolidation at critical $2,000 psychological support awaiting May 18 WPIC quarterly validation of March 4 deficit revision as structural scarcity thesis conflicts with technical breakdown momentum
Key Drivers This Week
Primary driver: Technical downtrend from January 2026 peak at $2,915 creating persistent headwinds despite WPIC March 4 revised 240 koz fourth consecutive deficit forecast as price consolidates around critical $2,000 psychological support following last week's correct bearish call
Secondary factor: Macro regime classified RISK-ON with VIX at 16.89 (below 20 threshold) yet China April PMI acceleration to 52.20 (strongest recent print) provides constructive industrial demand signal while elevated real yields above 1.90% create competing precious metals headwind
Additional influence: Current $2,004.65 price sits 31.2% below January $2,915 parabolic peak establishing base above critical $2,000-2,011 support zone identified by Technical discipline while May 18 WPIC Quarterly report looms as next major fundamental catalyst 15 days forward
Economic backdrop: China manufacturing PMI accelerated to 52.20 in April from 50.80 (strongest recent reading) supporting industrial demand outlook; Fed on hold at 3.5-3.75% with real yields at 1.90% creating persistent headwind for non-yielding precious metals despite easing cycle
Fundamental assessment: WPIC March 4 revised 2026 to 240 koz deficit (fourth consecutive year) with above-ground stocks at critically low 2.613M oz (4-month supply) fundamentally bullish, yet market rejected catalyst with initial -10% decline suggesting profit-taking or credibility discount after 109% YoY rally
Price Structure
Downtrend persisting with price 31% below January $2,915 peak testing critical $2,000-2,011 support zone; RSI estimated 42-45 showing momentum deterioration without bullish divergence while daily ranges $60-100 suggest consolidation after prior $150-200 extreme volatility
Trend strength at 4/10 paints a picture of a market with some direction but lacking strong conviction.
Upside & Downside
Primary risk: Breakdown below $2,000 psychological support triggers technical cascade toward $1,880 February low despite WPIC bullish deficit revision as elevated real yields above 1.90% and normalized VIX reduce safe-haven demand creating 6-8% downside risk within 2-3 weeks (Probability: medium)
Primary opportunity: Sustained reclaim above $2,050 resistance validates reversal from correction lows enabling rally toward $2,200 resistance as market reprices WPIC's fourth consecutive deficit year (689 koz average annually 2026-2029) combined with critically low 4-month inventory coverage at fundamental inflection (Timeframe: 3-6 weeks contingent on sustained hold above $2,000 support and May 18 WPIC quarterly report providing bullish supply-demand confirmation allowing fundamental scarcity narrative to reassert over technical momentum)
This week's edge: Maintaining tactical bearish lean at reduced conviction acknowledges critical $2,000 support test and May 18 binary catalyst; market may be underestimating WPIC's 2-5 year deficit thesis (689 koz average annually) and China PMI acceleration creating 3-6 week reversal setup if support holds, or correctly pricing profit-taking after 109% YoY rally requiring deeper consolidation toward $1,880
Volatility Context
At the 78th percentile of its 90-day range, platinum price volatility is running hot, creating both opportunity and risk for directional traders. Realised vol is declining steadily, compressing into ranges that tend to snap when a catalyst breaks the equilibrium.
High but contracting volatility suggests daily ranges of $60-100 expected versus $150-200 during peak January-March phase; breakdown below $2,000 would likely expand ranges to $80-120 on stop-triggered selling while sustained hold enables compression to $40-80 signaling consolidation completion
Week Ahead Outlook
The next major catalyst is WPIC Platinum Quarterly Q1 2026 report scheduled to provide updated supply-demand data validating or challenging March 4 deficit revision and assessing hydrogen catalyst impact on demand trajectory on Monday 18 May — a high-impact event that could materially shift the directional picture.
For PL futures, the balance between existing momentum and scheduled risk events sets the stage for the week ahead.
This analysis covers one dimension. Our full weekly report combines six specialist agents into a single actionable briefing with directional bias, key levels, and risk-opportunity matrix.
Start Free — Get the Market of the WeekFree weekly report · No credit card · Upgrade anytime


