Nasdaq 100 Key Levels This Week — Support, Resistance & Confluence Zones
Nasdaq 100 key levels breakdown: support zones, resistance zones, confluence and price structure.

Structural Assessment
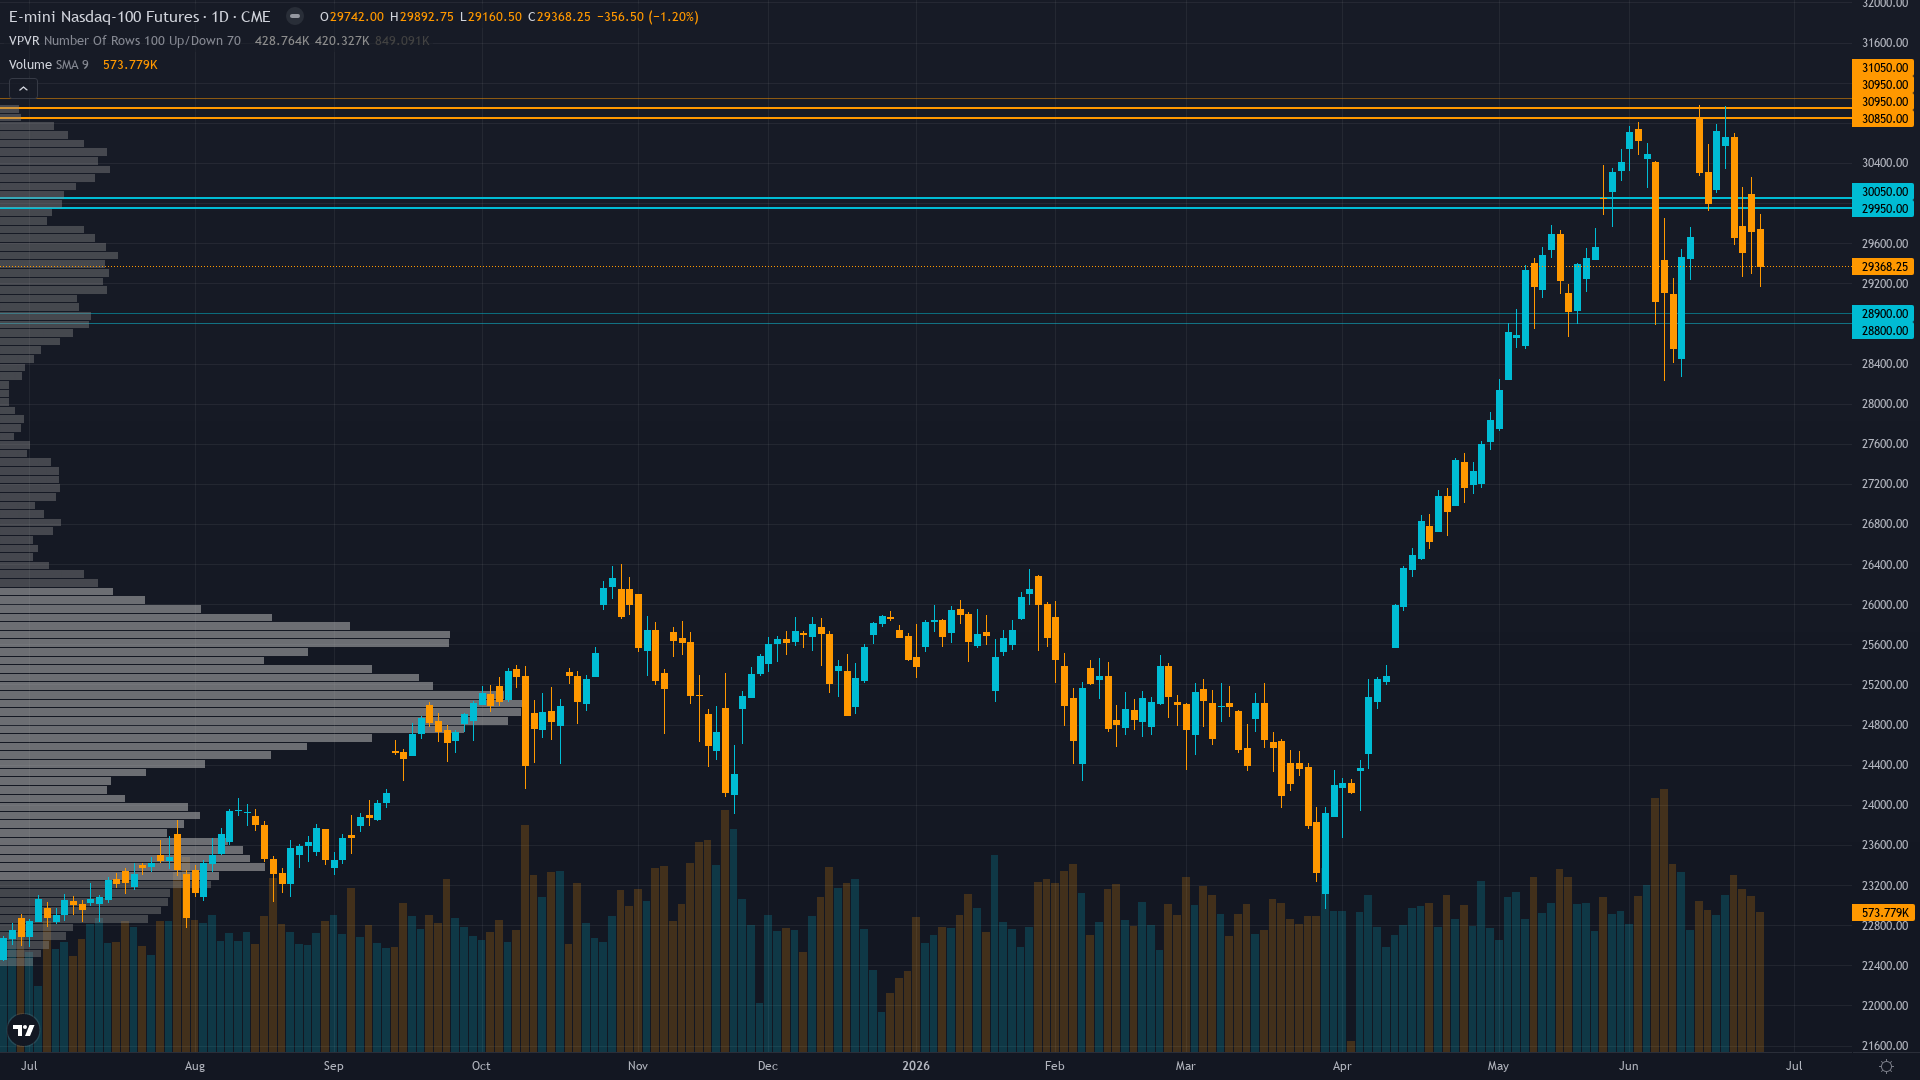
Trading at 29298.5 after a 1.20% slide, Nasdaq 100 faces sustained selling interest. Nasdaq 100 futures is consolidating, with price compressing into a narrower range as the market builds energy for its next move.
Breakdown structure with price at 29,298 below 50-day MA (29,744) after -4.5% weekly decline, still above 200-day MA (25,733) preserving longer-term bull structure, RSI neutral, intraday range 29,184-29,713 showing consolidation after selloff
At 5/10, trend strength is middling — enough to suggest a lean, but not enough to trade with high confidence.
Support Architecture
Support levels for Nasdaq 100 are defined by zones of prior institutional demand. The depth and frequency of prior tests at these levels determines their likely strength.
The strength of support depends on the current TRANSITIONAL with mixed signals. VIX at 18.41 sits below 20 threshold indicating superficially normalized conditions, but NQ suffered -4.5% weekly decline through June 25 representing technical breakdown below 50-day MA at 29,744. The June 17 FOMC meeting removed easing bias per multiple sources, shifting 2026 rate expectations from one cut to zero with possible hike scenario. Equities in corrective structure below key moving average resistance but still holding above critical 200-day MA at 25,733. Credit spreads stable, regime lacks clear directional conviction—neither bulls nor bears have structural advantage absent specific catalyst strong enough to override fundamental repricing underway from dovish-to-hawkish Fed trajectory shift. regime and volume profile at each level.
Upside Barriers
Resistance levels above Nasdaq futures current price represent zones of historical supply. The significance of each level scales with the number of prior tests and the volume traded there.
The current consolidating regime influences how aggressively these resistance zones are likely to be tested and whether they hold or fold.
Confluence & Methodology
Confluence is the differentiator between a line on a chart and a level worth trading. For Nasdaq 100 futures, the zones with the highest conviction are those validated across technical, institutional, and derivatives dimensions simultaneously.
Normal volatility at 62nd percentile suggests 1.2-1.5x normal daily ranges; expect 300-370 point daily swings versus normal 250-300 ranges; breakouts above 29,744 or breakdowns below 28,850 carry moderate sustainability as normalized vol allows standard position sizing, recent -4.5% weekly move demonstrates directional conviction when catalysts align
Beyond Lines on a Chart
Our approach to key levels is designed to filter noise from signal. Six independent agents each assess the same price zones from different perspectives. A level confirmed by one discipline is interesting. A level confirmed by four or five is worth building a trade plan around.
This multi-discipline approach means the levels in our paid reports carry institutional-grade confluence — not just lines on a chart, but zones validated across every analytical dimension that matters.
Our paid reports include specific support and resistance levels identified by six specialist agents — technical structure, institutional positioning, options flow, fundamentals, sentiment, and economic analysis. Not just lines on a chart, but zones validated by multi-discipline confluence.
Start Free — Get the Market of the WeekFree weekly report · No credit card · Upgrade anytime