Nasdaq 100 Key Levels This Week — Support, Resistance & Confluence Zones
Nasdaq 100 key levels breakdown: support zones, resistance zones, confluence and price structure.

Price Architecture
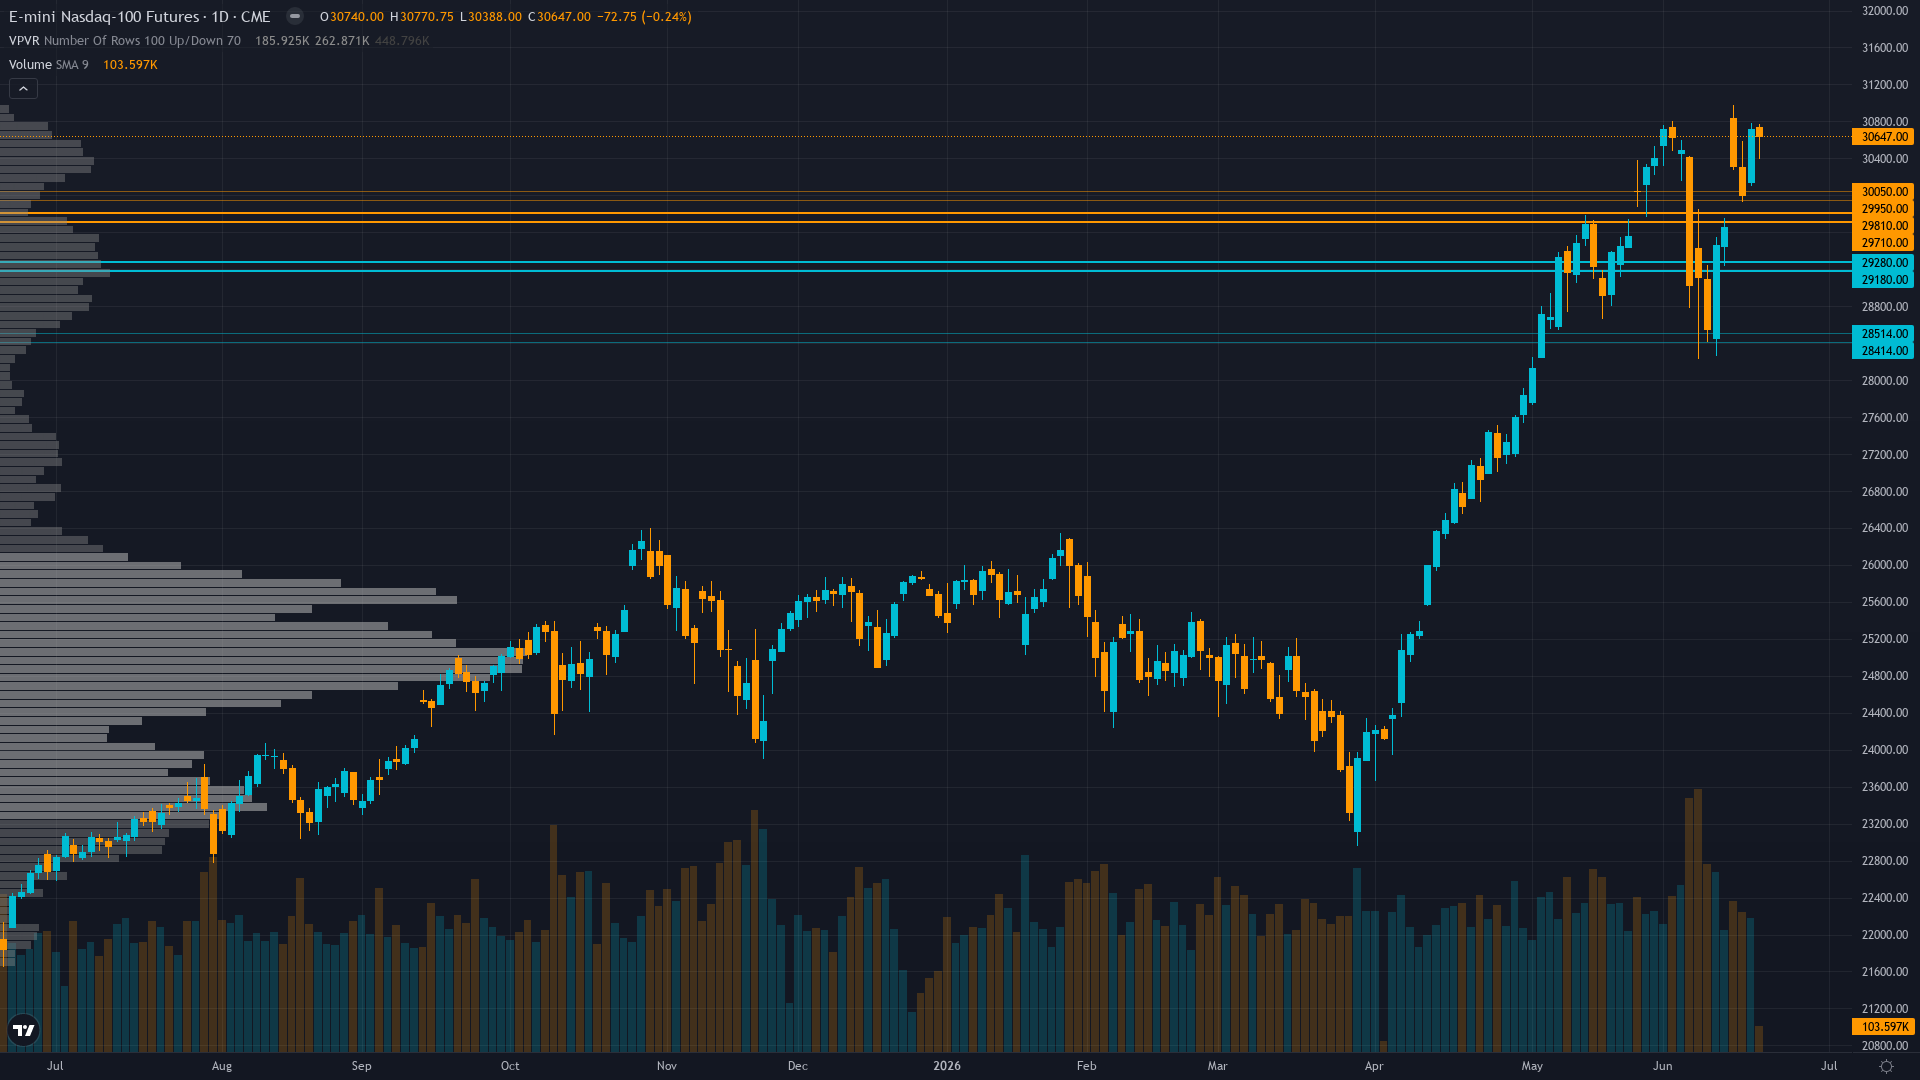
Nasdaq 100 holds at 30647, off 0.24% in a modest retracement from recent levels. The market in Nasdaq 100 futures is coiling, with narrowing price ranges suggesting stored energy that will eventually release.
Uptrend intact with price at 30,647 above 50-day MA (29,576) and 200-day MA (29,606), consolidating in 30,500-30,700 range after rejecting 30,900-31,000 resistance zone mid-June, RSI 55.4 neutral showing neither overbought nor oversold conditions, support layers at 30,000 psychological and 28,850 major from June 11 test
Trend strength registers at 6/10, suggesting meaningful but not extreme directional bias.
Downside Protection
The downside architecture for tech futures features support zones rooted in prior buying activity. These are not arbitrary lines but areas where real capital has previously been committed.
The reliability of support under RISK-ON with consolidation characteristics. VIX at 16.41-16.78 sits well below 20 threshold indicating normalized risk appetite, credit spreads at historical tights (IG 80bps, HY 285bps), equities near all-time highs with NQ at 30,647 just 253 points below May 31 peak of 30,900. However, June 17 Fed language shift removing easing bias per CNBC/CNN coverage represents structural repricing from dovish to neutral stance that occurred 4 days ago and appears absorbed given price stability. Regime favors continued risk-on positioning absent specific catalyst strong enough to trigger reversal. conditions is shaped by the interplay between volatility regime and historical volume at each level.
Resistance Zone Context
The upside path for NQ futures is marked by resistance zones where prior selling activity created structural barriers. Clearing these zones requires either strong momentum or a shift in the fundamental picture.
In the current market state, resistance zones remain key decision points.
Analytical Convergence
The most actionable levels for Nasdaq 100 are those where multiple analytical disciplines converge. When technical structure, institutional positioning, and options flow all point to the same zone, the probability of price reacting there increases meaningfully.
Normal volatility at 52nd percentile suggests 1.0-1.2x normal daily ranges; expect 250-320 point daily swings versus March extreme's 400-550 ranges; breakouts above 30,900 or breakdowns below 30,000 carry moderate sustainability as normalized vol allows standard position sizing
Our Multi-Agent Approach to Key Levels
The levels in our paid reports are generated by six specialist agents working in parallel. Technical analysis provides the structural framework, institutional data shows where capital is committed, options flow reveals hedging behaviour, fundamentals anchor levels to value, sentiment gauges crowd positioning, and economic analysis times the catalysts.
The output is a curated set of levels with institutional-grade validation — the kind of multi-dimensional analysis that hedge fund research desks produce, delivered at a fraction of the cost.
Our paid reports include specific support and resistance levels identified by six specialist agents — technical structure, institutional positioning, options flow, fundamentals, sentiment, and economic analysis. Not just lines on a chart, but zones validated by multi-discipline confluence.
Start Free — Get the Market of the WeekFree weekly report · No credit card · Upgrade anytime


