Nasdaq 100 Key Levels This Week — Support, Resistance & Confluence Zones
Nasdaq 100 key levels breakdown: support zones, resistance zones, confluence and price structure.

Current Price Structure
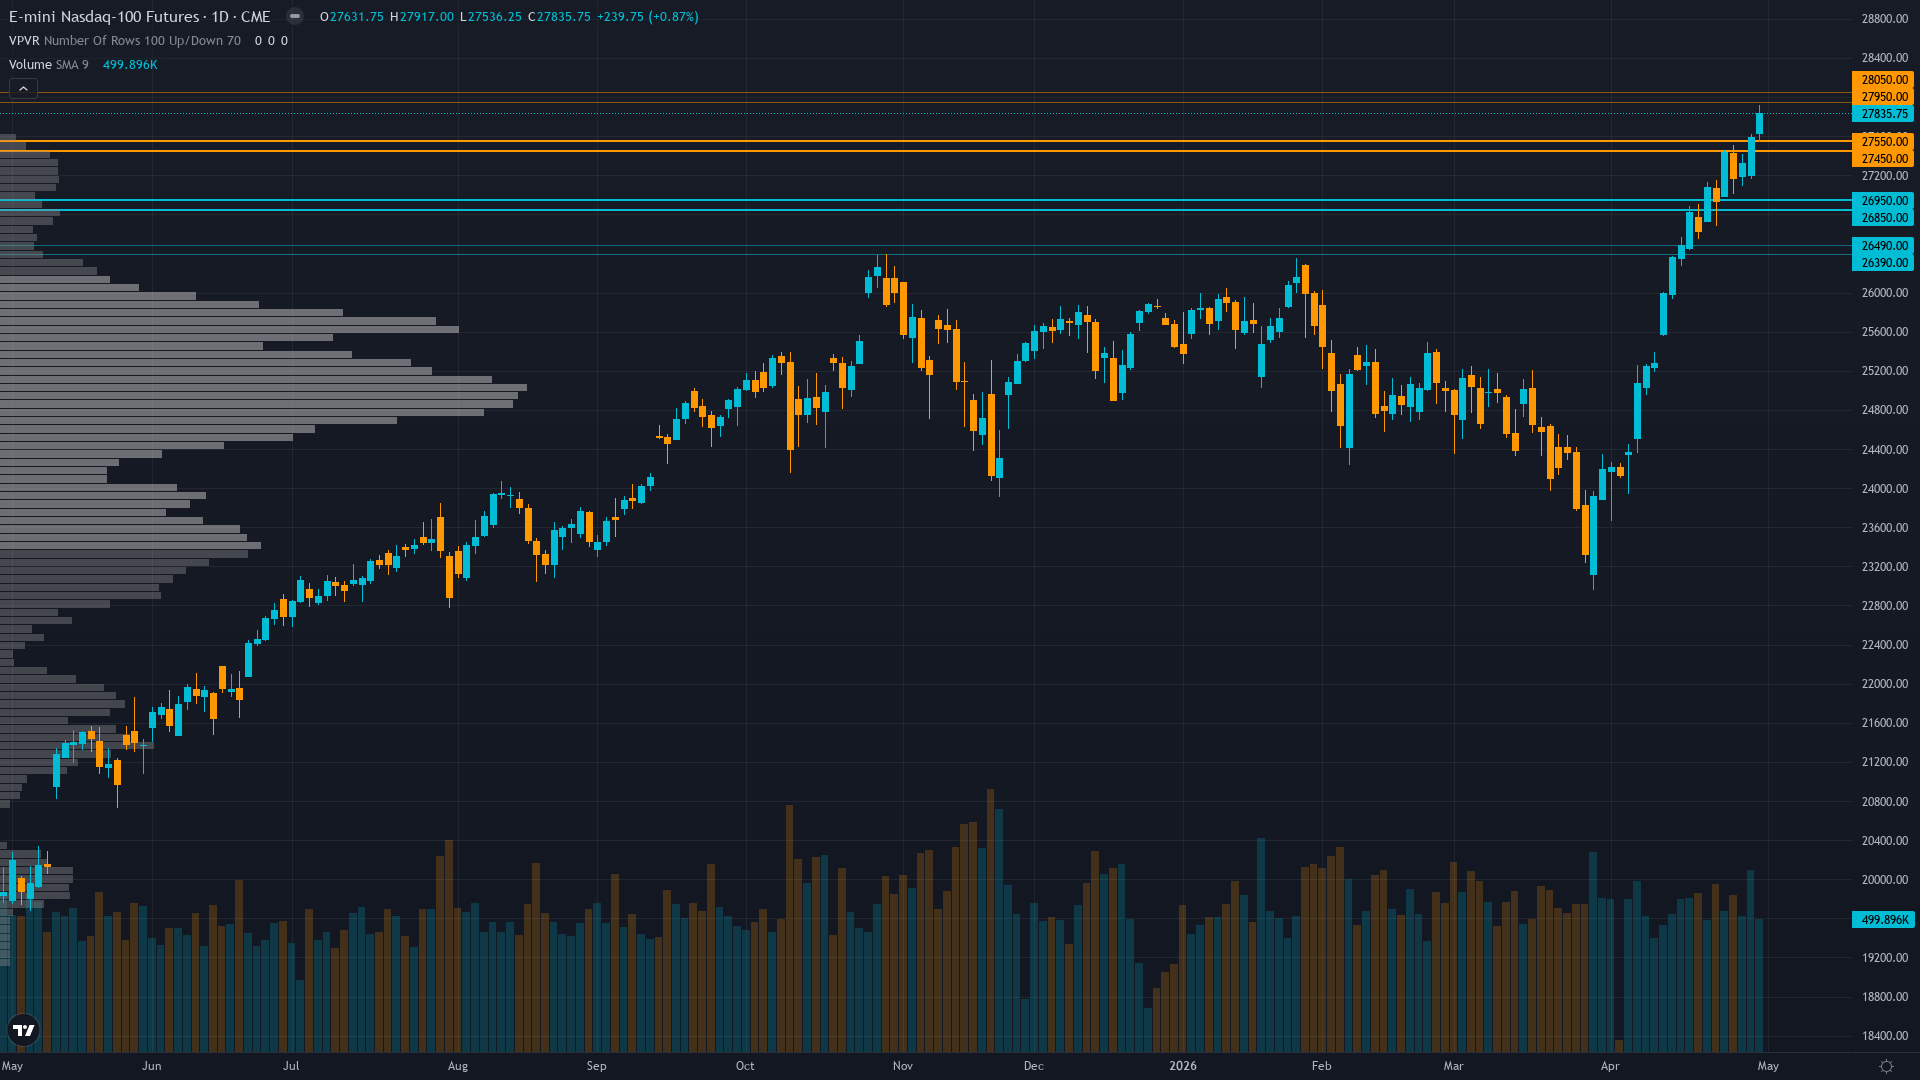
Trading at 27835.75 with a 0.87% uptick, Nasdaq 100 is drifting higher without strong conviction. Nasdaq 100 futures is in a breaking out market state, requiring careful assessment of current conditions.
Powerful uptrend breakout with price at 27,835 extending above 52-week high of 27,917 set May 2, trading 740 points above 50-day MA (27,095) and 2,493 points above 200-day MA (25,342), RSI 72.58 overbought but momentum intact, all moving averages aligned bullishly confirming trend strength
Trend strength registers 8/10 — a reading that suggests the directional impulse has real staying power.
Support Zone Context
Below the current level, Nasdaq futures has structural support where demand has historically stepped in. The reliability of these zones depends on the volume profile and the number of prior interactions.
In the current RISK-ON: VIX at 16.99 well below 20 threshold indicating normalized risk appetite, equities in powerful uptrend with NQ breaking new all-time highs, Fed accommodative at 3.5-3.75%, credit stable, USD modestly weaker, regime strongly supportive of continued risk asset appreciation with structural AI capex tailwind environment, support zones carry standard probability of reaction.
Ceilings & Supply Zones
Above current price, Nasdaq 100 futures faces resistance zones where selling pressure has historically intensified. These levels represent previous supply zones, profit-taking areas, or structural barriers that price needs to overcome for continuation.
How firmly these zones hold depends on the confluence of volume, prior reactions, and the current market regime.
Where Disciplines Converge
For Nasdaq futures, the levels that matter most are those confirmed by independent analytical approaches. When six different disciplines identify the same zone, the signal-to-noise ratio improves dramatically.
Normal volatility at 55th percentile suggests 1.0-1.2x normal daily ranges; expect 250-300 point daily swings versus March extreme's 400-550 ranges; breakouts above 28,000 or pullbacks to 27,500 carry moderate sustainability as normalized vol allows tighter stops and standard position sizing versus defensive March stance
How Macro Agent Desk Identifies Key Levels
Macro Agent Desk identifies key levels through a six-agent process. Each analytical discipline contributes independently — technical for structure, institutional for smart money interest, options for hedging activity, fundamentals for fair value context, sentiment for crowd positioning, and economics for catalyst timing.
What this means in practice: every key level in the full weekly report has been stress-tested across multiple independent analytical frameworks before it reaches the page.
Our paid reports include specific support and resistance levels identified by six specialist agents — technical structure, institutional positioning, options flow, fundamentals, sentiment, and economic analysis. Not just lines on a chart, but zones validated by multi-discipline confluence.
Start Free — Get the Market of the WeekFree weekly report · No credit card · Upgrade anytime


