Nasdaq 100 Forecast This Week — Outlook, Drivers & Key Levels
This week's Nasdaq 100 outlook: key drivers, volatility context, risk-opportunity assessment and the week ahead.

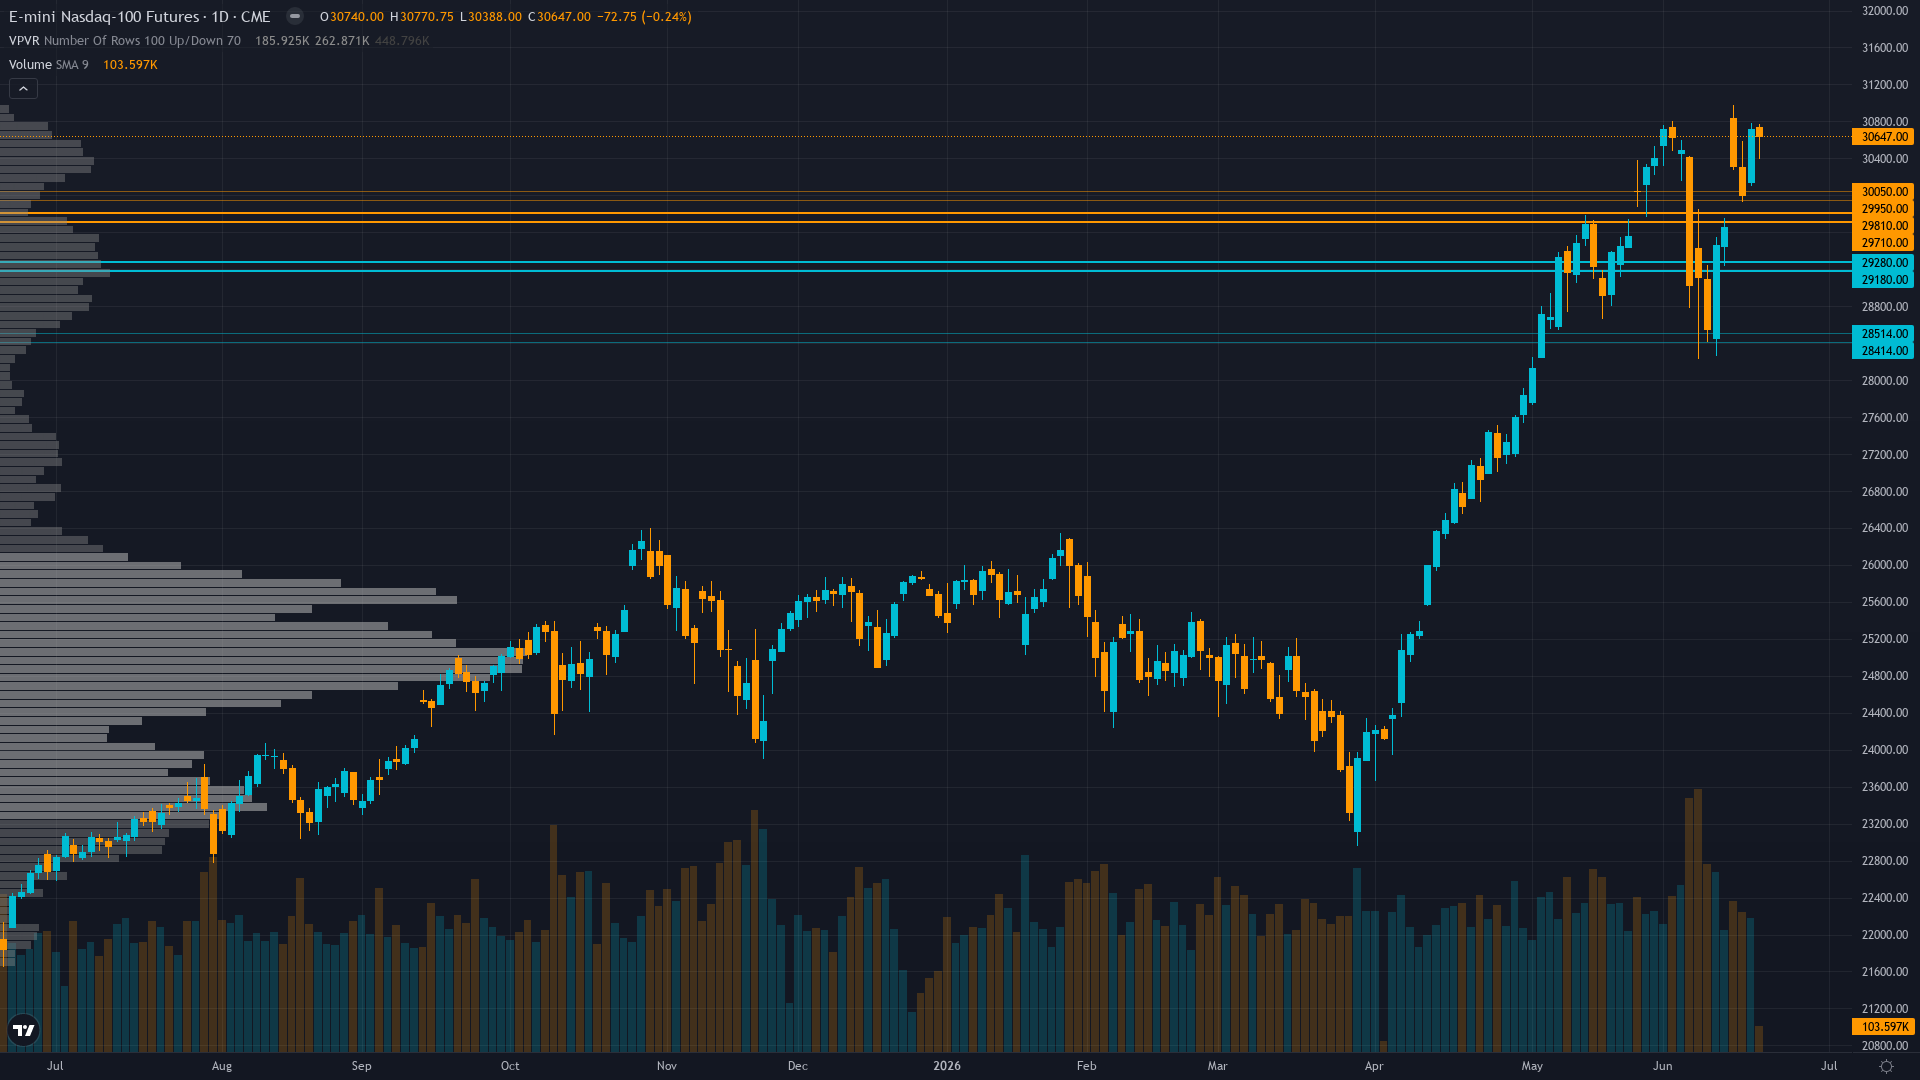
Current Market Picture
Nasdaq 100 is trading at 30647, down 0.24% in a measured pullback. The market in Nasdaq 100 futures is coiling, with narrowing price ranges suggesting stored energy that will eventually release.
Cautiously constructive acknowledging technical uptrend integrity and RISK-ON regime persistence but defensive given June 17 FOMC removal of easing bias shifting rate expectations and elevated valuations requiring Q2 earnings execution starting July
Key Drivers This Week
Primary driver: Miss reset requirement triggered after 3 consecutive MISSED calls (June 19, June 12, June 5) mandating NEUTRAL bias per Rule 5, overriding otherwise mixed discipline constellation with Technical (+2.0) and Options (+1.5) bullish signals offset by no fresh weekly catalyst and June 17 FOMC hawkish repricing now 4 days absorbed
Secondary factor: June 16-17 FOMC meeting (4 days ago) held rates at 3.5-3.75% as expected but removed easing bias per multiple sources, triggering -1.34% Nasdaq selloff on June 17 as markets repriced from dovish to neutral/hawkish stance, though price has since recovered to 30,647 suggesting initial shock absorbed
Additional influence: Technical structure shows NQ consolidating at 30,647 between resistance at 30,900-31,000 (rejected June 15-19 per TradingView analysis) and support at 30,000 psychological/28,850 major, with RSI 55.4 neutral and price above both 50-day MA (29,576) and 200-day MA (29,606) maintaining uptrend integrity
Economic backdrop: Fed held at 3.5-3.75% at June 16-17 FOMC (4 days ago) with unanimous 12-0 vote, removed easing bias per multiple sources (CNBC, TheStreet, CNN) shifting 2026 rate expectations from one cut to zero, credit spreads at 25-year tights (80bps IG) indicating extreme risk appetite, AI capex $725B structural tailwind
Fundamental assessment: NQ P/E 36x (25% above 28.79x long-term average) represents moderate overvaluation requiring Q2 earnings validation starting July, forward earnings growth +21-22% YoY robust per Zacks June data, AI capex cycle at $700-725B 2026 structural support but no new fundamental catalyst this week
Price Structure
Uptrend intact with price at 30,647 above 50-day MA (29,576) and 200-day MA (29,606), consolidating in 30,500-30,700 range after rejecting 30,900-31,000 resistance zone mid-June, RSI 55.4 neutral showing neither overbought nor oversold conditions, support layers at 30,000 psychological and 28,850 major from June 11 test
Trend strength sits at 6/10, reflecting a market that has directional bias but hasn't reached extreme conviction.
Volatility Regime
Volatility for NQ futures is at the 52th percentile over 90 days — a normal regime that allows for standard position sizing and conventional trade management. The vol trend is flat, with no meaningful shift across timeframes. Stable vol environments often lull traders before a regime change arrives.
Normal volatility at 52nd percentile suggests 1.0-1.2x normal daily ranges; expect 250-320 point daily swings versus March extreme's 400-550 ranges; breakouts above 30,900 or breakdowns below 30,000 carry moderate sustainability as normalized vol allows standard position sizing
Bull & Bear Case
Primary risk: Breakdown below 30,000 psychological support triggers acceleration toward 28,850-29,576 major support zone as June 17 FOMC hawkish repricing combines with elevated 36x forward P/E requiring multiple compression if higher-for-longer rates persist without Q2 earnings growth validation starting July (Probability: medium)
Primary opportunity: Hold above 30,000-30,400 support zone combined with quarter-end window dressing flows (June 30 nine days away) and VIX compression continuation from 16.78 drives recovery toward 31,000 resistance as June 17 FOMC shock fully absorbs and AI capex structural support ($725B) reasserts with Q2 earnings season approaching July (Timeframe: 1-2 weeks as quarter-end rebalancing flows materialize June 27-30 and July ISM Manufacturing (July 1) plus early Q2 earnings provide directional clarity, with historical 65% probability quarter-end creates 1-2% performance drift in leading sectors)
This week's edge: Resetting after 3 consecutive MISSED calls (June 19, June 12, June 5) - thesis under review per mandatory Rule 5 requirement for EQUITY_INDEX category
Week Ahead Outlook
ISM Manufacturing PMI for June 2026 released July 1 at 10:00 AM EDT, testing whether pricing pressures continue from May's 54.0 expansion reading with input costs rising at fastest pace in four years creating inflation concerns on Wednesday 1 July is the next scheduled catalyst, with moderate potential to influence near-term price action.
For tech futures, the balance between existing momentum and scheduled risk events sets the stage for the week ahead.
This analysis covers one dimension. Our full weekly report combines six specialist agents into a single actionable briefing with directional bias, key levels, and risk-opportunity matrix.
Start Free — Get the Market of the WeekFree weekly report · No credit card · Upgrade anytime


