Nasdaq 100 Forecast This Week — Outlook, Drivers & Key Levels
This week's Nasdaq 100 outlook: key drivers, volatility context, risk-opportunity assessment and the week ahead.

Current Market Picture
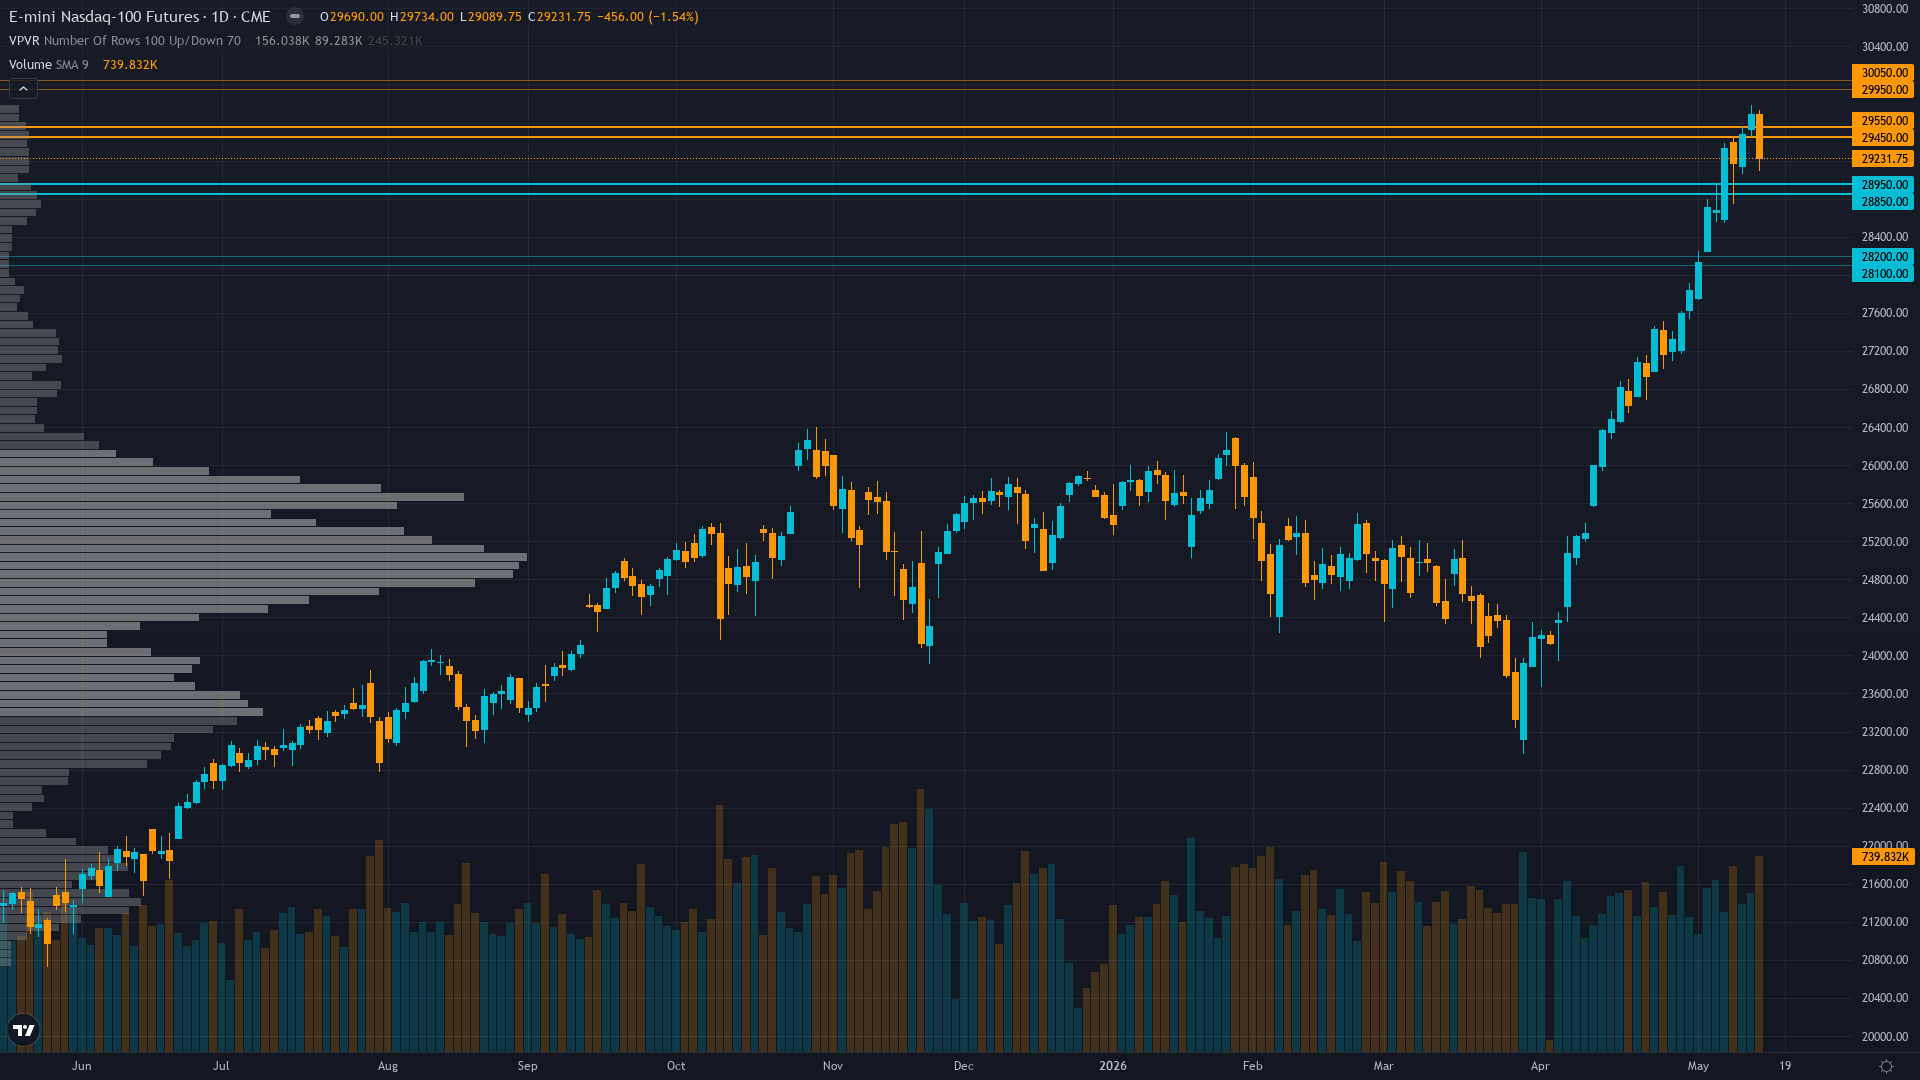
Trading at 29231.75 after a 1.54% slide, Nasdaq 100 faces sustained selling interest. The market in Nasdaq 100 futures is coiling, with narrowing price ranges suggesting stored energy that will eventually release.
Cautiously constructive acknowledging Q1 earnings strength but increasingly defensive on April CPI reacceleration removing Fed dovish support, with strategists pushing rate cut expectations from June to September or later as higher-for-longer narrative reasserts
Key Drivers This Week
Primary driver: April CPI reacceleration to 3.4% YoY (released May 13) shifting Fed expectations from June cut to likely hold, with market repricing hawkish trajectory as VIX rises to 18.43 and NQ pulls back -1.54% from prior session highs near 29,734
Secondary factor: Technical pullback from resistance at psychological 30,000 level after failing breakout attempt, with price at 29,232 now below 5-day MA (29,234) indicating near-term momentum loss though still above 50-day MA (29,124) preserving uptrend structure
Additional influence: Institutional positioning showing contrarian bearish signal with elevated net long exposure and material QQQ ETF outflow ($3.27B on May 5) combining with low equity put/call ratio (0.59) indicating complacency risk ahead of June 16-17 FOMC meeting
Economic backdrop: Fed held at 3.5-3.75% after April 29 FOMC with next meeting June 16-17 showing 98% probability of hold per Polymarket, but April CPI released May 13 accelerated to 3.4% YoY from 3.0% (hawkish surprise) driven by 17.9% energy inflation, materially shifting 2026 rate cut expectations from 1-2 cuts to zero per JPMorgan forecasts
Fundamental assessment: Q1 2026 earnings validated tech strength with aggregate +15.1% YoY growth and full-year 2026 EPS estimates revised up from 15.6% to 22.6%, forward P/E at 24.74 near fair value against growth expectations, but $700B AI capex requires continued execution validation and April CPI reacceleration removes dovish Fed support pillar
Price Structure
Uptrend intact but weakening with price at 29,232 above 50-day MA (29,124) and well above 200-day MA (27,202) confirming longer-term bullish structure, but failure to break above 30,000 resistance and close below 5-day MA (29,234) signals near-term momentum loss with RSI at 45.4 neutral showing no divergence
Trend strength sits at 6/10, reflecting a market that has directional bias but hasn't reached extreme conviction.
Upside & Downside
Primary risk: Breakdown below 29,090 critical support triggers acceleration toward 29,124 50-day MA or lower as April CPI reacceleration (3.4% vs 3.0%) removes Fed dovish support and elevated positioning (low put/call 0.59, QQQ outflows) creates vulnerability to sentiment-driven deleveraging (Probability: medium)
Primary opportunity: Hold above 29,090-29,124 support zone combined with Q1 earnings validation of 22.6% 2026 growth and VIX compression back below 18 drives recovery toward 30,000 resistance as April CPI shock gets absorbed and AI capex sustainability narrative reasserts (Timeframe: 2-4 weeks as May CPI (released June 10) provides next inflation data point clarifying whether April spike was transitory or structural, with June 16-17 FOMC then setting policy trajectory)
This week's edge: Market may be underweighting speed at which April CPI reacceleration (3.4% vs 3.0%) eliminates 2026 rate cut probability and removes key valuation support for duration-sensitive tech at 24.74x forward P/E, while overweighting near-term Q1 earnings strength that was achieved under more dovish Fed expectations now shifting hawkish
Volatility Context
At the 52th percentile, NQ futures volatility sits in a normal range, neither compressed enough to signal a breakout nor elevated enough to demand caution. Realised vol is trending higher across the curve, which tends to accompany transitional periods where the market is repricing risk.
Normal volatility at 52nd percentile suggests 1.0-1.2x normal daily ranges; expect 280-330 point daily swings versus normal 250-280 ranges; breakouts above 29,734 or breakdowns below 29,090 carry moderate sustainability as normalized vol allows standard position sizing
Week Ahead Outlook
The next major catalyst is June 16-17 FOMC meeting with rate announcement, updated dot plot projections, and Summary of Economic Projections critical for assessing policy trajectory after April CPI reacceleration to 3.4% eliminated near-term dovish bias on Tuesday 16 June — a high-impact event that could materially shift the directional picture.
For tech futures, the balance between existing momentum and scheduled risk events sets the stage for the week ahead.
This analysis covers one dimension. Our full weekly report combines six specialist agents into a single actionable briefing with directional bias, key levels, and risk-opportunity matrix.
Start Free — Get the Market of the WeekFree weekly report · No credit card · Upgrade anytime