Nasdaq 100 Forecast This Week — Outlook, Drivers & Key Levels
This week's Nasdaq 100 outlook: key drivers, volatility context, risk-opportunity assessment and the week ahead.

Market Overview
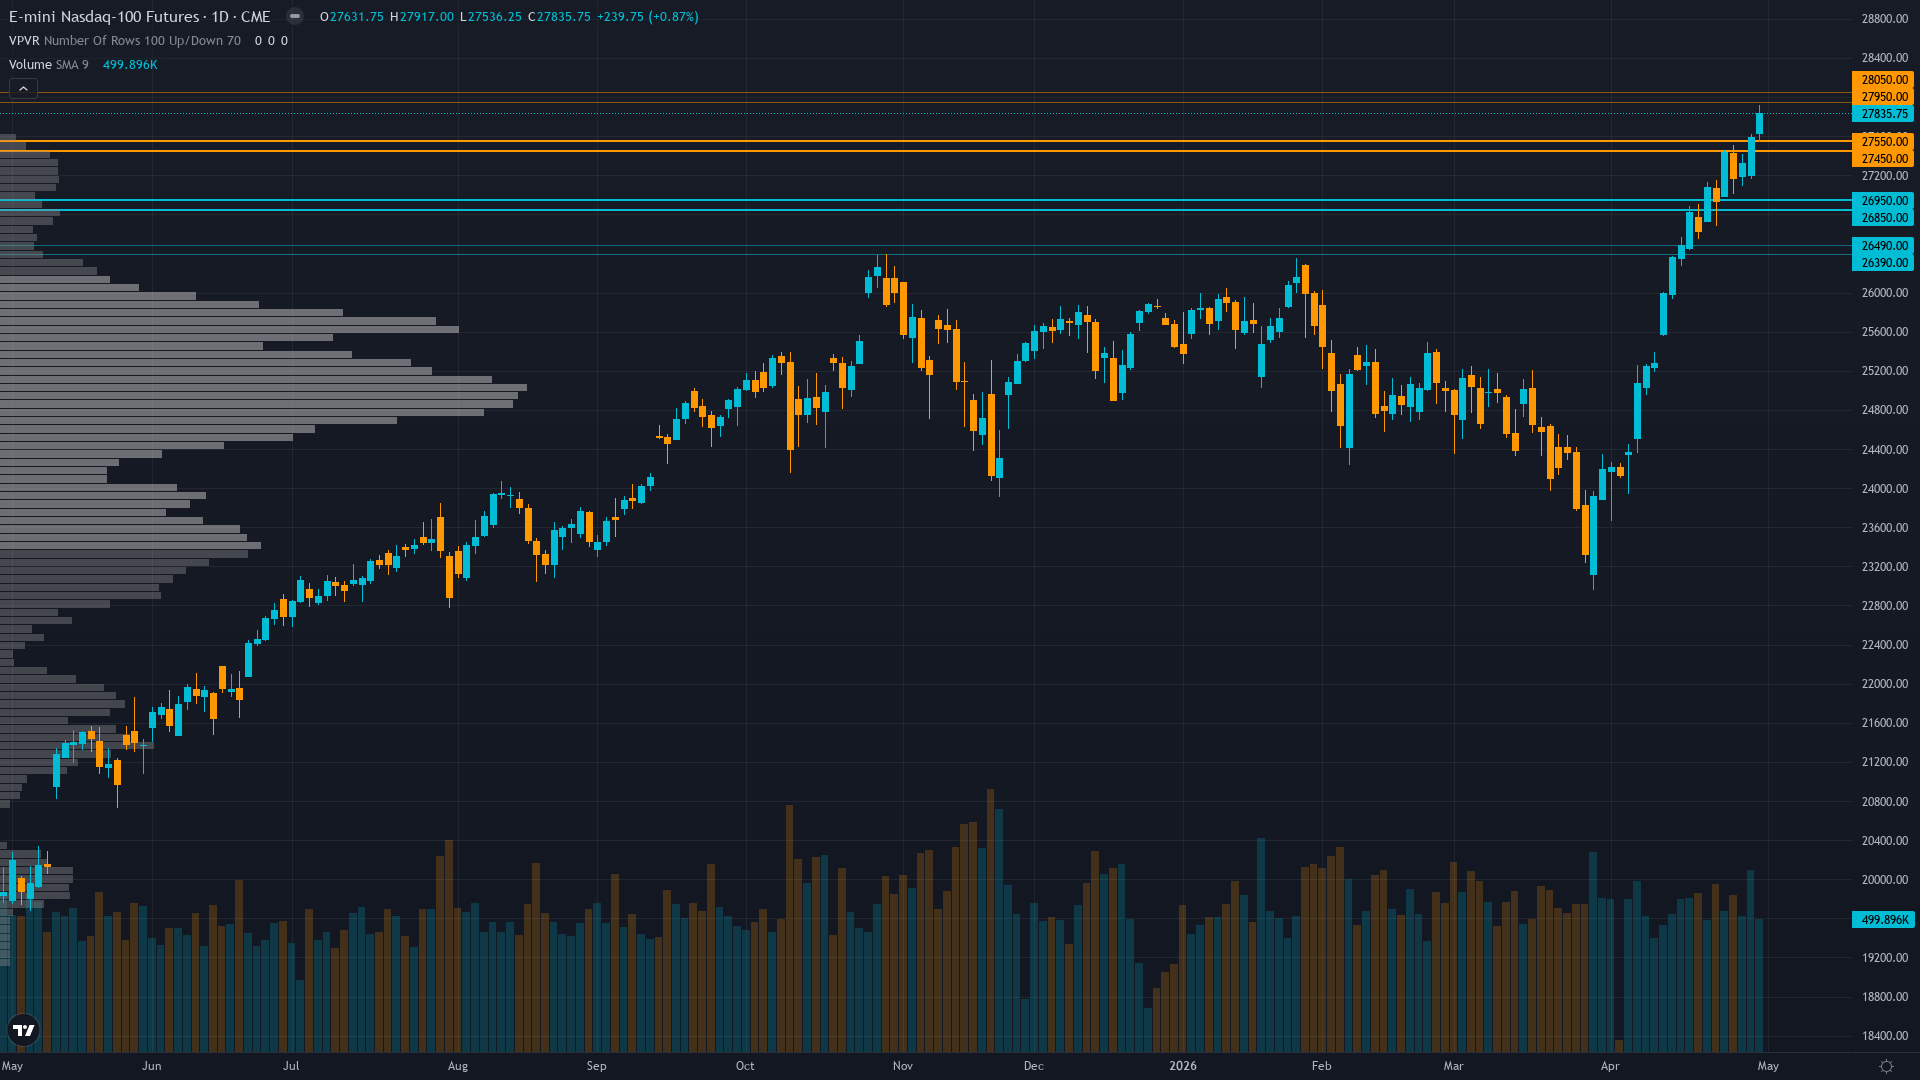
Nasdaq 100 holds at 27835.75, up a marginal 0.87% as the market grinds forward. Nasdaq 100 futures is in a breaking out market state, requiring careful assessment of current conditions.
Constructively bullish on technical breakout confirmation and Q1 earnings validation with strategists forecasting 7-12% 2026 gains, though acknowledging overbought technicals and complacent sentiment create near-term consolidation risk
This Week's Catalysts & Drivers
Primary driver: Powerful technical breakout to new 52-week high at 27,917 on May 2-3, 2026, confirming bullish trend structure and breaking above prior November 2025 all-time high of 26,182 with strong momentum and Q1 hyperscaler earnings validating AI capex cycle sustainability
Secondary factor: RISK-ON macro regime with VIX normalized at 16.99 (well below 20 threshold after March spike to 60.13), Fed on hold at 3.5-3.75%, and hyperscaler Q1 2026 earnings showing explosive AI infrastructure spending acceleration ($700B+ combined 2026 capex across GOOGL, AMZN, MSFT, META)
Additional influence: Mandatory miss reset period completed successfully after 5 consecutive missed calls, last week's NEUTRAL correctly captured +1.4% move, restoring analytical credibility and allowing resumption of directional calls per Rule 5
Economic backdrop: Fed held at 3.5-3.75% after April 29 FOMC with dissent from Miran (preferred cut) signaling internal dovish pressure, ISM Manufacturing 52.7 showing expansion though slight miss, hyperscaler Q1 earnings showed explosive AI capex growth validating structural investment cycle, next FOMC June 16-17
Fundamental assessment: Q1 2026 earnings season (concluded late April) validated growth with 84% beat rate and aggregate +15.1% YoY growth, hyperscalers raised 2026 AI capex to combined $700B+ (META $125-145B, GOOGL up to $185B, AMZN $200B, MSFT $120B+), though elevated 22.3x tech P/E requires continued execution
Technical Picture
Powerful uptrend breakout with price at 27,835 extending above 52-week high of 27,917 set May 2, trading 740 points above 50-day MA (27,095) and 2,493 points above 200-day MA (25,342), RSI 72.58 overbought but momentum intact, all moving averages aligned bullishly confirming trend strength
At 8/10, trend strength signals that directional momentum is firmly in control.
Bull & Bear Case
Primary risk: RSI at 72.58 deeply overbought combined with equity put/call 0.46 extreme complacency and elevated institutional positioning near 75-85th percentile creates risk of near-term pullback toward 27,095-27,500 support if momentum divergence develops or June FOMC delivers hawkish surprise on rate path (Probability: medium)
Primary opportunity: Technical breakout above prior all-time high of 26,182 confirmed on May 1-2 combining with RISK-ON regime persistence (VIX sub-17), Q1 earnings validating $700B+ AI capex sustainability, and Fed pause maintaining accommodative conditions drives sustained extension toward 28,000-28,500 resistance as trend momentum accelerates (Timeframe: 2-4 weeks as breakout extension typically produces 3-5% follow-through moves within 10-15 trading days when confirmed on volume with supporting fundamentals, June FOMC providing next major catalyst for directional clarity)
This week's edge: Market may be underweighting the significance of confirmed breakout above 26,182 all-time high on strong volume which historically produces 3-5% follow-through within 10-15 days with 65-70% probability when supported by fundamental catalysts, while overweighting near-term overbought RSI readings that can persist for weeks in powerful trends within RISK-ON regimes
Volatility Regime
Volatility for NQ futures is at the 55th percentile over 90 days — a normal regime that allows for standard position sizing and conventional trade management. The vol trend is flat, with no meaningful shift across timeframes. Stable vol environments often lull traders before a regime change arrives.
Normal volatility at 55th percentile suggests 1.0-1.2x normal daily ranges; expect 250-300 point daily swings versus March extreme's 400-550 ranges; breakouts above 28,000 or pullbacks to 27,500 carry moderate sustainability as normalized vol allows tighter stops and standard position sizing versus defensive March stance
What to Watch
The June 16-17 FOMC meeting decision with updated dot plot and first meeting expected for new Fed Chair Kevin Warsh (pending Senate confirmation May 11), critical for assessing policy trajectory and tech valuation support as AI capex cycle sustainability faces scrutiny on Tuesday 16 June stands as the week's primary risk event — high-impact and capable of overriding the existing technical and sentiment setup.
The interplay between breaking out market conditions and upcoming catalysts will define this week's trading landscape for Nasdaq futures.
This analysis covers one dimension. Our full weekly report combines six specialist agents into a single actionable briefing with directional bias, key levels, and risk-opportunity matrix.
Start Free — Get the Market of the WeekFree weekly report · No credit card · Upgrade anytime


