Gold Key Levels This Week — Support, Resistance & Confluence Zones
Gold key levels breakdown: support zones, resistance zones, confluence and price structure.

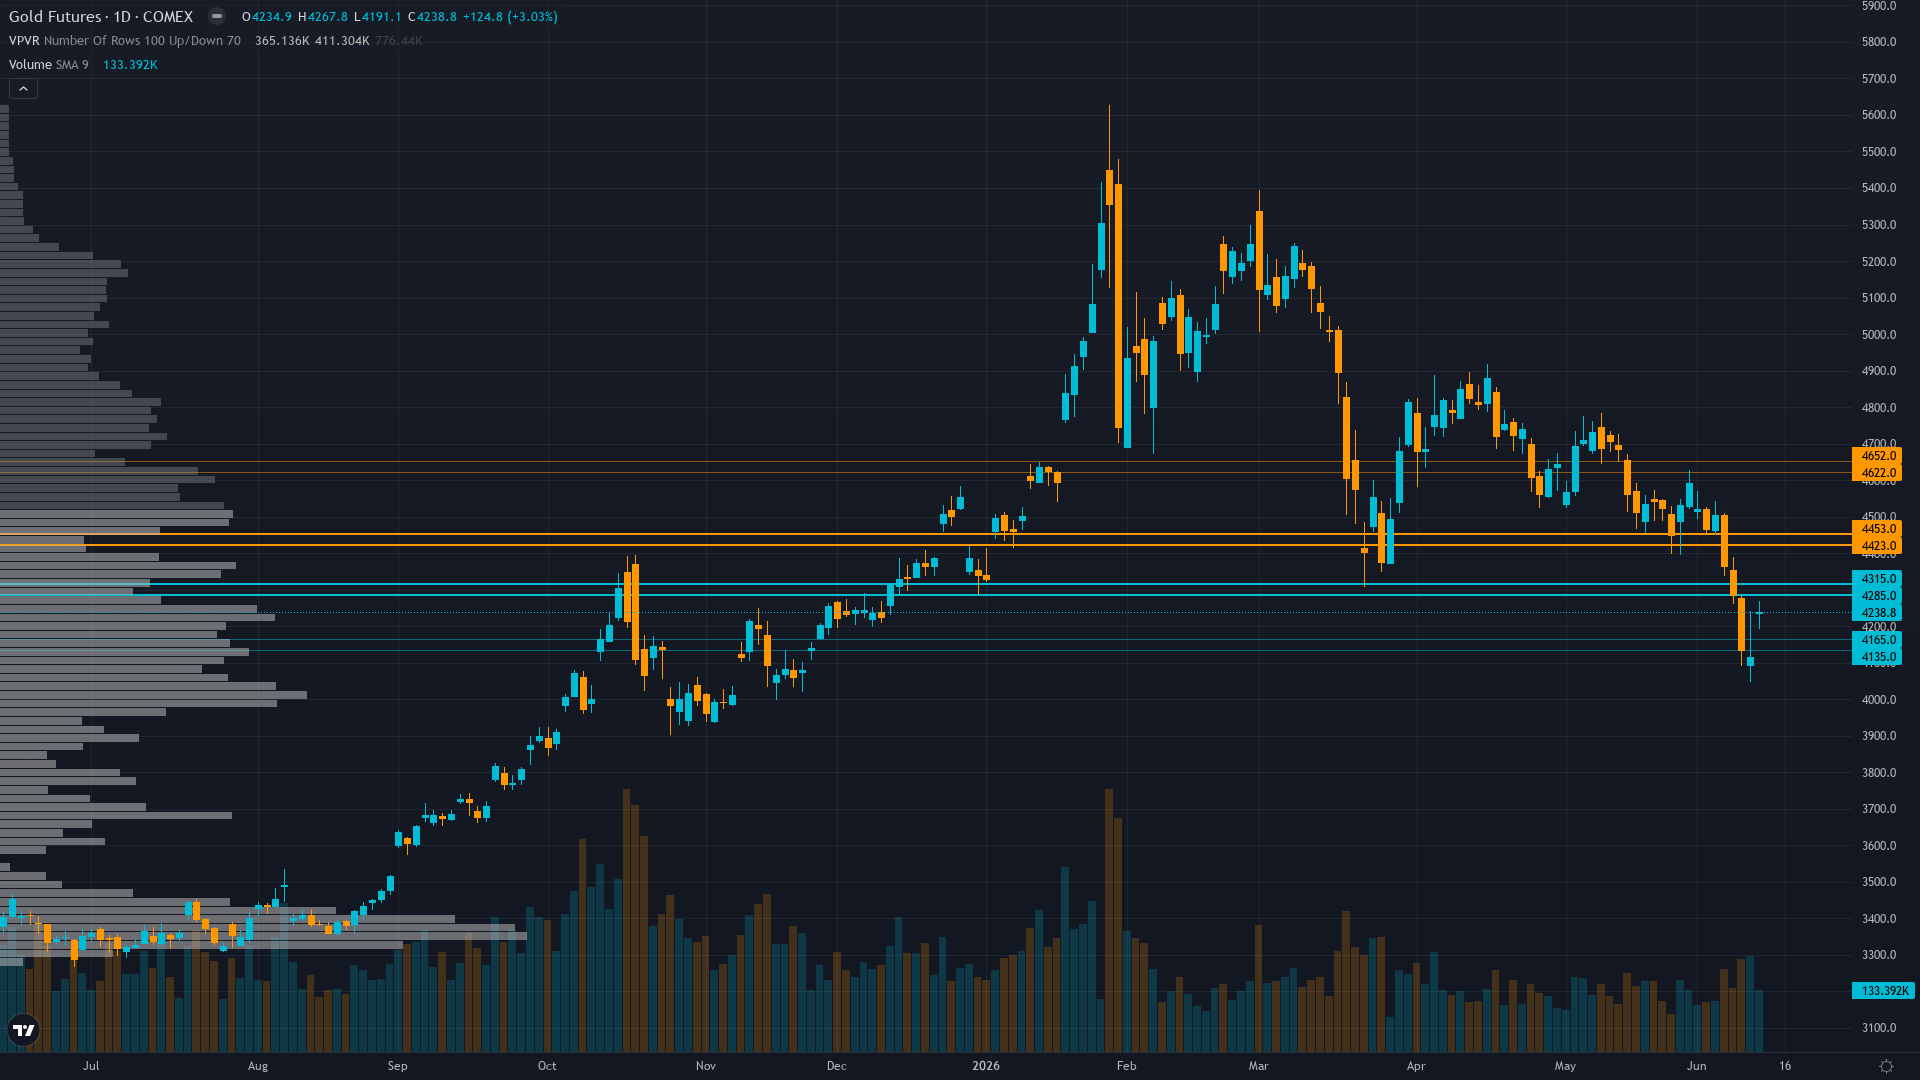
Current Price Structure
gold pushed to 4238.8 on a 3.03% advance, reflecting sustained demand across the session. gold futures is in a breaking down market state, requiring careful assessment of current conditions.
Breaking down decisively with price at $4,239 extending 25% decline from January $5,626 peak, trading below both 50-day MA $4,912 and 200-day MA $4,438, RSI 36-45 weak zone showing no bullish divergence, next major support $4,186 then $4,000 psychological level
With trend strength at only 2/10, any directional bias is thin and easily disrupted.
Support Zone Context
Below the current level, COMEX gold has structural support where demand has historically stepped in. The reliability of these zones depends on the volume profile and the number of prior interactions.
In the current breakdown continuation in pre-FOMC holding pattern environment, support zones carry heightened risk of aggressive tests.
Ceilings & Supply Zones
Above current price, gold futures faces resistance zones where selling pressure has historically intensified. These levels represent previous supply zones, profit-taking areas, or structural barriers that price needs to overcome for continuation.
How firmly these zones hold depends on the confluence of volume, prior reactions, and the current market regime.
Where Disciplines Converge
For COMEX gold, the levels that matter most are those confirmed by independent analytical approaches. When six different disciplines identify the same zone, the signal-to-noise ratio improves dramatically.
Elevated volatility at 82nd percentile requires wider stops with daily ranges potentially 2.5-3.5% versus normal 1.5-2.0%; current $4,200-4,450 breakdown zone suggests breakouts become more reliable once volatility normalizes below 70th percentile post-June FOMC, but until then price action subject to elevated noise and false signal risk creating unfavorable environment for directional conviction
How Macro Agent Desk Identifies Key Levels
Macro Agent Desk identifies key levels through a six-agent process. Each analytical discipline contributes independently — technical for structure, institutional for smart money interest, options for hedging activity, fundamentals for fair value context, sentiment for crowd positioning, and economics for catalyst timing.
What this means in practice: every key level in the full weekly report has been stress-tested across multiple independent analytical frameworks before it reaches the page.
Our paid reports include specific support and resistance levels identified by six specialist agents — technical structure, institutional positioning, options flow, fundamentals, sentiment, and economic analysis. Not just lines on a chart, but zones validated by multi-discipline confluence.
Start Free — Get the Market of the WeekFree weekly report · No credit card · Upgrade anytime