Gold Forecast This Week — Outlook, Drivers & Key Levels
This week's Gold outlook: key drivers, volatility context, risk-opportunity assessment and the week ahead.

Market Overview
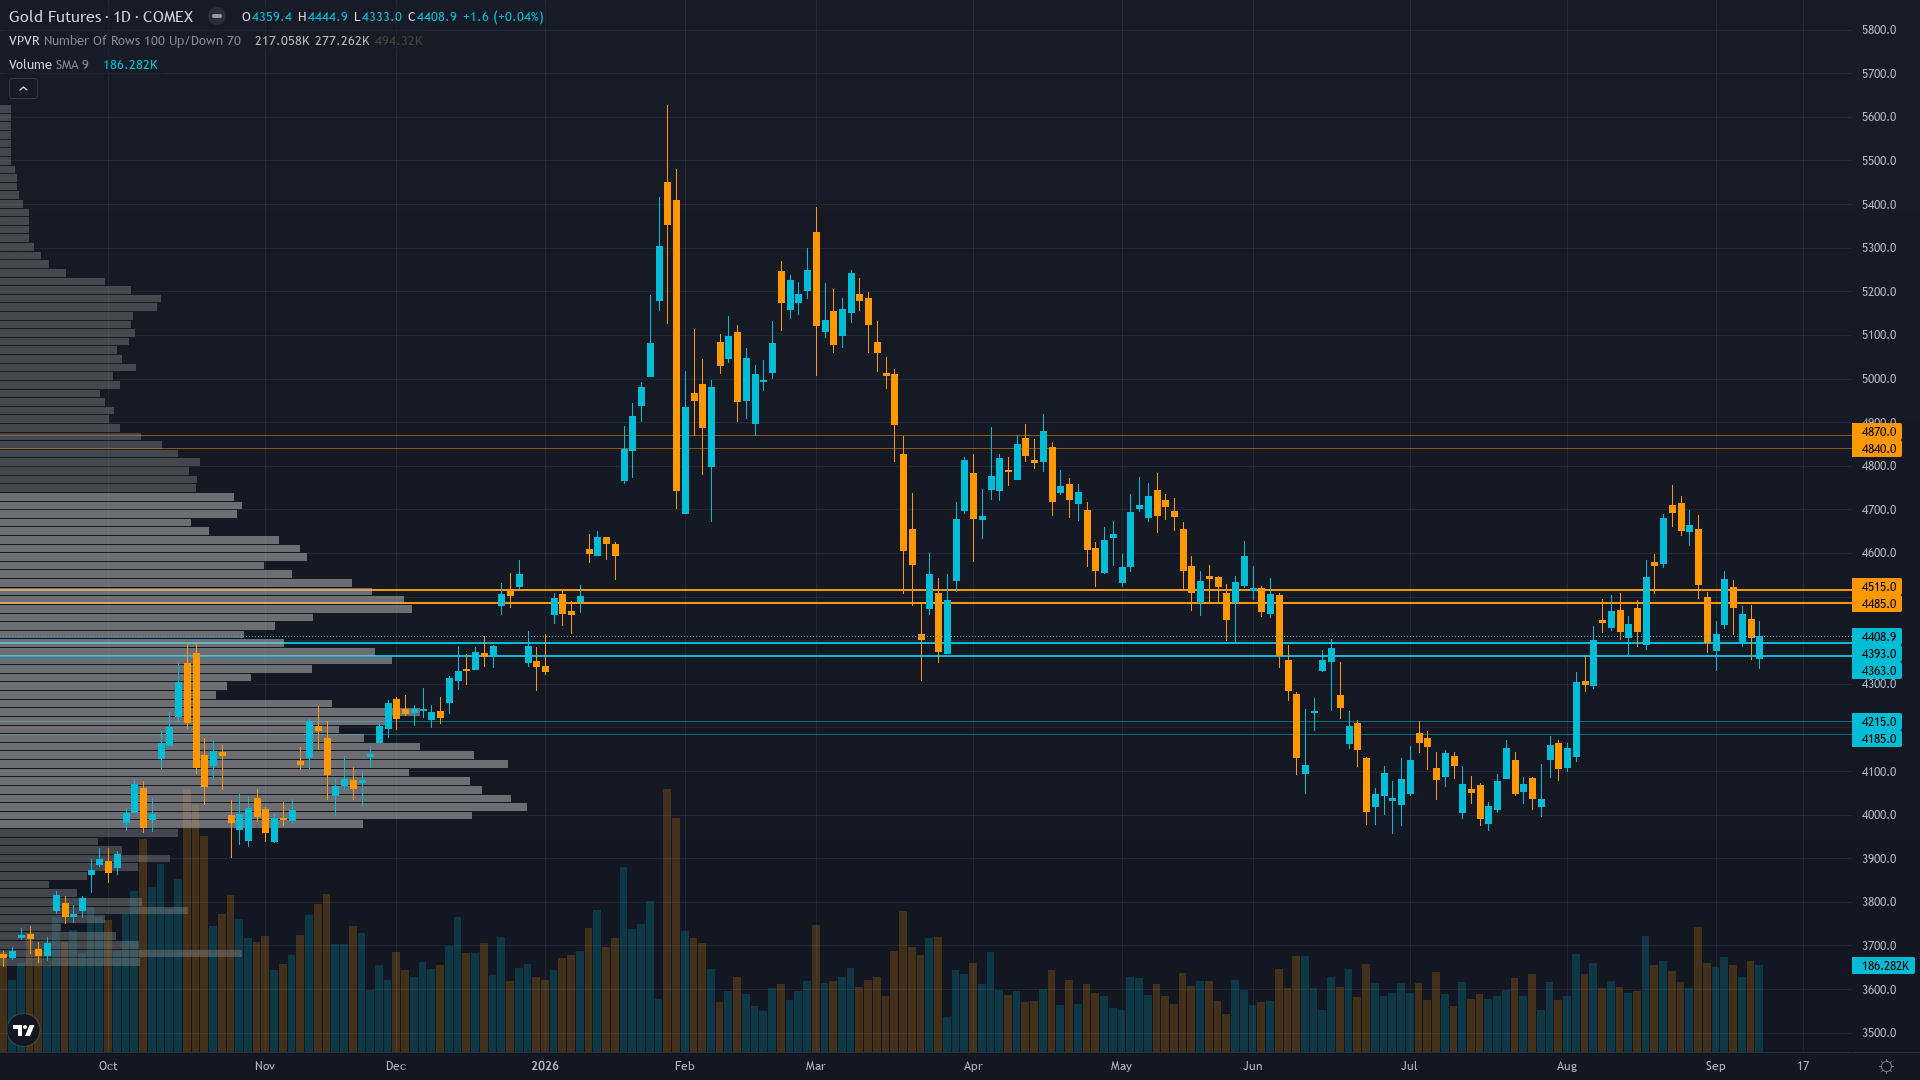
gold sits at 4366.2 after slipping 0.12% — a shallow pullback rather than a decisive move. gold futures is range-bound and tightening, with decreasing volatility signalling a directional resolution ahead.
Cautiously bullish on gold with institutional year-end targets at $4,500-$4,900, but near-term positioning increasingly defensive after the hot August PPI repriced FOMC hike odds to ~60% and drove 10Y yields to 4.96%, with the September 16 FOMC now the critical binary catalyst
This Week's Catalysts & Drivers
Primary driver: Hawkish FOMC repricing after August PPI surprise (+0.4% MoM vs +0.3% expected) drove September rate hike odds from 31% to 60%, with the September 16 FOMC decision and dot plot now the dominant binary catalyst for gold's near-term direction
Secondary factor: Real yield surge: 10-year Treasury yield climbed 18bp in a week to 4.96%, the highest since the July 1 shock, directly pressuring gold's valuation framework which shows 5-8% overvaluation vs traditional real yield models
Additional influence: COT non-commercial net long at 231,960 contracts (63.3rd 3-year percentile) represents mildly elevated speculative positioning vulnerable to liquidation if the hawkish catalyst triggers a downside break below $4,329 support
Economic backdrop: TRANSITIONAL-to-hawkish: Fed funds rate 3.63% with Sep 16 FOMC now carrying ~60% hike probability after hot Aug PPI; 10Y Treasury at 4.96% (+18bp weekly); inflation at 2.36% above target; DXY at 99.09 providing only mild offset; VIX at 15.84 signaling calm equities but that is not supporting gold in current real-yield-driven regime
Fundamental assessment: Gold appears 5-8% overvalued at $4,366 vs real yield models placing fair value at $4,000-$4,150; central bank demand (288.9t Q2, +62% y/y) provides a structural floor but is insufficient to offset the real yield headwind from 10Y at 4.96% without a fresh easing catalyst
Technical Picture
Price at $4,366 below both 50-day MA ($4,510) and 200-day MA ($4,638), consolidating in $4,329-$4,558 range with RSI approaching oversold; immediate support at $4,329 (Sep 2 low) is critical — a break below accelerates selling toward $4,200 major support
At 4/10, trend strength is middling — enough to suggest a lean, but not enough to trade with high confidence.
Risk Environment
With vol at the 65th percentile over 90 days, gold price is in a measured regime that doesn't require unusual adjustments. Volatility is contracting, with realised vol declining across timeframes. Compressed volatility often precedes sharp directional moves as energy builds.
Normal volatility at 65th percentile supports 1.5-2.0% daily ranges — the $4,329 support and $4,400 resistance provide near-term trading levels with reasonable reliability, but the Sep 16 FOMC binary event increases false signal risk; breakouts may not sustain until after the catalyst resolves
Risk-Reward Assessment
Primary risk: FOMC on Sep 16 delivers a hawkish surprise — either a 25bp rate hike or dot plot signaling additional tightening — that breaks gold below $4,329 support toward $4,200 as speculative long liquidation from the 63.3rd percentile COT positioning compounds the technical damage (Probability: medium)
Primary opportunity: FOMC delivers a dovish hold with reduced tightening bias, causing a sharp reversal of the post-PPI hawkish repricing and triggering a relief rally back toward $4,500 resistance as gold's September seasonal tailwind (+2.1% average, 64% positive years) provides multi-week structural support (Timeframe: Next 1-2 weeks through the Sep 16 FOMC decision, with the potential for a catalyst-driven move of 2-4% in either direction depending on the outcome of the dot plot and forward guidance)
This week's edge: The market may be underestimating how quickly the hawkish PPI repricing has shifted the FOMC outlook — hike odds surged from 31% to 60% in a single week, yet most institutional gold targets remain unchanged at $4,500-$4,900; combined with COT speculative positioning at the 63.3rd percentile creating liquidation vulnerability, the asymmetry favours a pre-FOMC bearish lean with the potential for a sharp reprice if the dot plot confirms a hawkish trajectory, though conviction is capped at 5 due to the prior week's missed BULLISH call and the desk's historically poor BEARISH track record on GC
What to Watch
NY Empire State Manufacturing Index (Sep) — High impact; estimate 15 vs prior 20.6; first read on September economic activity (Tuesday 15 September) sits in the medium-impact category — unlikely to single-handedly shift the picture, but capable of adding directional fuel.
The interplay between consolidating market conditions and upcoming catalysts will define this week's trading landscape for COMEX gold.
This analysis covers one dimension. Our full weekly report combines six specialist agents into a single actionable briefing with directional bias, key levels, and risk-opportunity matrix.
Start Free — Get the Market of the WeekFree weekly report · No credit card · Upgrade anytime