Gold Forecast This Week — Outlook, Drivers & Key Levels
This week's Gold outlook: key drivers, volatility context, risk-opportunity assessment and the week ahead.

Market Overview
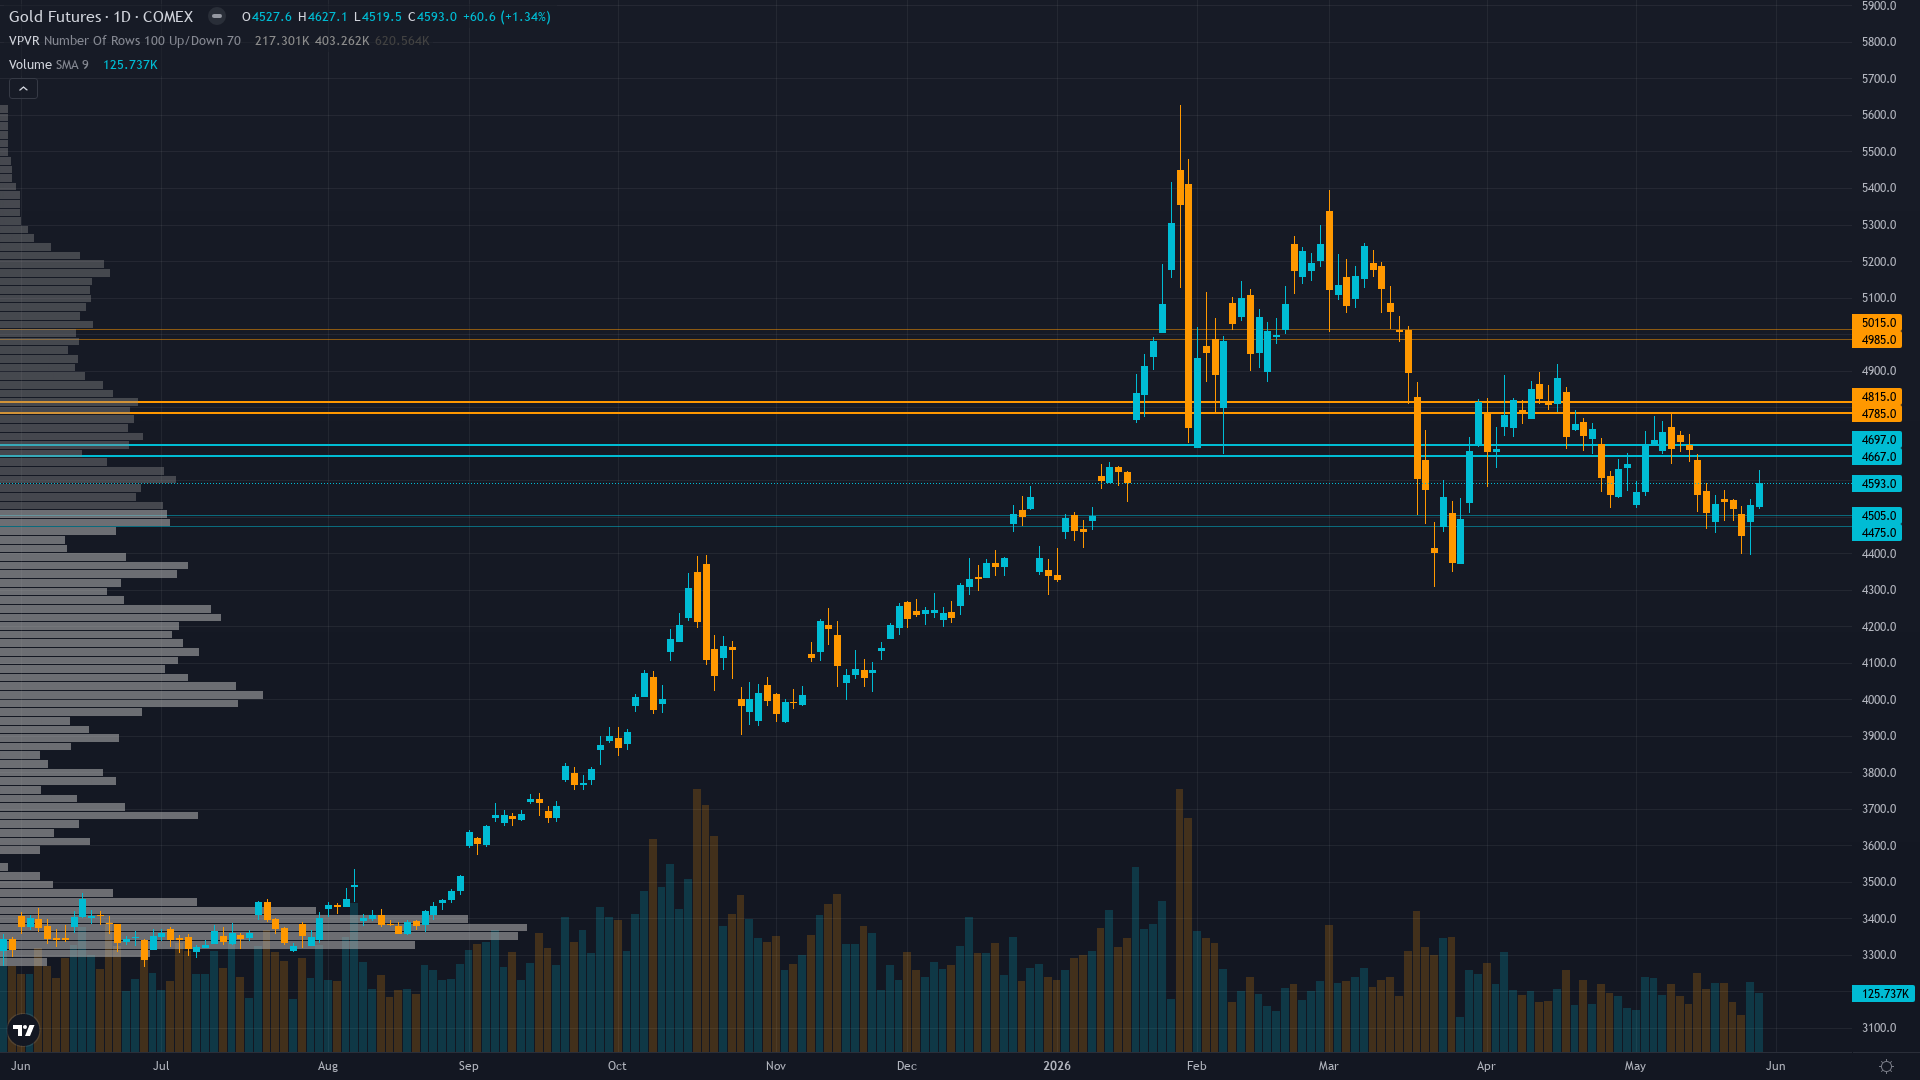
gold is trading at 4593, up 1.34% in the last 24 hours as buyers maintain control. gold futures is range-bound and tightening, with decreasing volatility signalling a directional resolution ahead.
Mixed with institutional year-end targets remaining at $5,000-5,400 maintaining structural bull case but near-term uncertainty elevated following 18% correction from January peaks and five consecutive weeks of directional analytical failures creating tactical caution
This Week's Catalysts & Drivers
Primary driver: Mandatory miss reset protocol after 5 consecutive failed directional calls requires NEUTRAL stance for at least one week while gold consolidates at $4,593 in post-correction holding pattern following 18% decline from January $5,626 all-time high
Secondary factor: June 16-17 FOMC meeting now 17 days away represents next major catalyst with Polymarket pricing 33% probability of December rate cut as first easing move, cementing higher-for-longer Fed trajectory as structural headwind to non-yielding gold
Additional influence: Q1 central bank demand held at 244 tonnes (+3% YoY) validating structural bid floor remains intact despite elevated 10Y TIPS real yields at 2.04% and May ETF outflows continuing Western institutional caution offsetting Eastern accumulation
Economic backdrop: Fed held April 29 at 3.50-3.75% with June 16-17 FOMC priced 98% hold per Polymarket, DXY at 98.94 providing neutral dollar backdrop, VIX at 17.44 below 20 threshold indicating normalized equity conditions creating RISK-ON regime paradoxically pressuring safe-haven gold
Fundamental assessment: Modestly undervalued at $4,593 versus institutional targets $5,000-5,400 with Q1 central bank demand 244t validating structural support, but elevated real yields 2.04% and higher-for-longer Fed stance create persistent cyclical headwind offsetting valuation support
Technical Picture
Consolidating at $4,593 in $4,519-4,627 daily range (May 31 data), price below 50-day MA ~$4,676 showing corrective structure intact but 18% recovery from March lows suggests stabilization attempt, RSI neutral zone with no directional conviction
At 4/10, trend strength is middling — enough to suggest a lean, but not enough to trade with high confidence.
Bull & Bear Case
Primary risk: Continued dollar strength above DXY 100 combined with June FOMC reaffirming hawkish higher-for-longer stance validates no 2026 rate cut scenario driving gold toward $4,440-4,300 major support zone representing additional 4-6% downside from current levels (Probability: medium)
Primary opportunity: Fed introduces dovish optionality at June 16-17 meeting suggesting eventual rate cut resumption triggers dollar reversal from current DXY 98.94 level and supports gold rally toward $4,900-5,000 resistance zone within 3-4 weeks as rate cut expectations resurface (Timeframe: Next 3-4 weeks through June 16-17 FOMC and into early July as market digests whether May consolidation at $4,590-4,730 range represents base-building for recovery or distribution before renewed decline toward $4,300-4,400 zone)
This week's edge: Resetting after 5 consecutive misses per Rule 5 — thesis under mandatory review. Market remains divided between structural bull case (Q1 central bank demand 244t, institutional targets $5,000+) and cyclical headwinds (elevated real yields 2.04%, Fed higher-for-longer, ETF outflows). Desk lacks clear informational edge in current consolidation environment and requires June 16-17 FOMC catalyst for directional clarity before resuming directional calls.
Volatility Regime
Volatility for gold price sits at the 72th percentile over 90 days — an elevated regime that demands wider risk parameters and faster decision-making. The vol trend is down, with contraction across timeframes creating the kind of coiled conditions that historically resolve explosively.
Elevated volatility at 72nd percentile requires wider stops with daily ranges potentially 2.0-3.0% versus normal 1.5-2.0%; current $4,500-4,700 consolidation zone suggests breakouts become more reliable once volatility normalizes below 65th percentile by late June post-FOMC, but until then price action subject to elevated noise and false signal risk creating unfavorable environment for directional conviction
What to Watch
The Federal Reserve FOMC Meeting decision June 16-17 representing next major catalyst with market pricing 98% probability of hold at 3.50-3.75% range, forward guidance critical for assessing rate cut timeline and real yield trajectory into second half 2026 on Wednesday 17 June stands as the week's primary risk event — high-impact and capable of overriding the existing technical and sentiment setup.
The interplay between consolidating market conditions and upcoming catalysts will define this week's trading landscape for COMEX gold.
This analysis covers one dimension. Our full weekly report combines six specialist agents into a single actionable briefing with directional bias, key levels, and risk-opportunity matrix.
Start Free — Get the Market of the WeekFree weekly report · No credit card · Upgrade anytime