Gold Forecast This Week — Outlook, Drivers & Key Levels
This week's Gold outlook: key drivers, volatility context, risk-opportunity assessment and the week ahead.

Current Market Picture
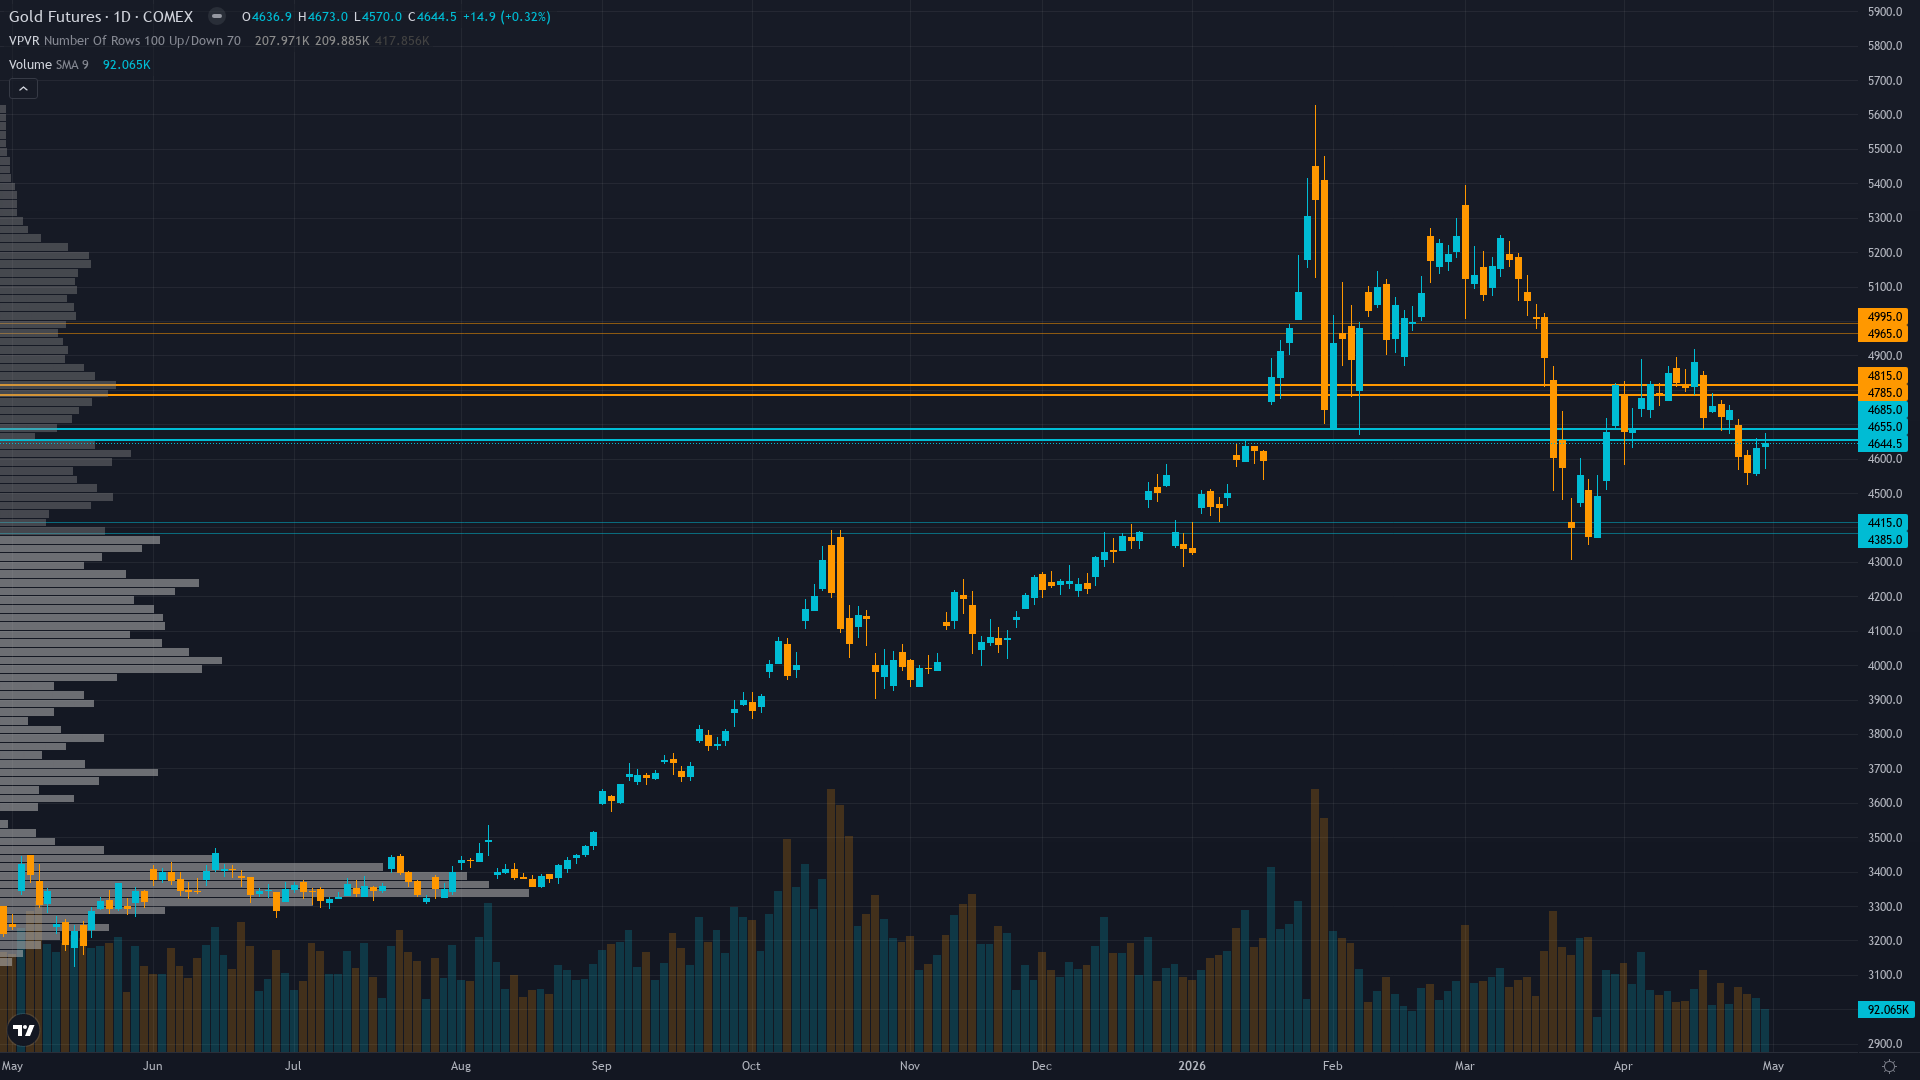
gold holds at 4650, up a marginal 0.68% as the market grinds forward. gold futures is in a breaking down market state, requiring careful assessment of current conditions.
Mixed with institutional price targets remaining at $5,000-5,400 but near-term positioning increasingly cautious following April 28-29 FOMC hawkish guidance eliminating near-term rate cut expectations and validating higher-for-longer trajectory
Key Drivers This Week
Primary driver: Post-FOMC breakdown extending with gold at $4,650 after April 28-29 hawkish Fed guidance cemented higher-for-longer stance creating sustained real yield headwind despite Q1 central bank demand holding firm at 244 tonnes
Secondary factor: Technical structure severely damaged with decisive break below $4,700 support following FOMC meeting confirming corrective phase from January $5,626 all-time high now exceeds 17% decline
Additional influence: Three consecutive missed calls degrading thesis credibility while conflicting discipline signals create informational uncertainty requiring tactical caution ahead of June FOMC decision cycle
Economic backdrop: Fed held April 28-29 at 3.5-3.75% as expected but delivered hawkish forward guidance cementing higher-for-longer stance, DXY at 98.2 consolidating after rebound above 100, VIX 16.89 below 20 threshold indicating normalized equity conditions creating RISK-ON backdrop paradoxically pressuring safe-haven gold
Fundamental assessment: Modestly undervalued at $4,650 versus institutional $5,000-5,400 targets but April 28-29 FOMC hawkish guidance validates higher-for-longer Fed trajectory creating persistent real yield headwind offsetting Q1 central bank demand of 244t that held firm
Price Structure
Breaking down through $4,700 support post-FOMC with price at $4,650 now 17% below January peak, RSI neutral zone 47-50 showing no directional conviction, next support $4,600 then major $4,450 zone
Trend strength at 4/10 paints a picture of a market with some direction but lacking strong conviction.
Upside & Downside
Primary risk: Continued dollar strength above DXY 100 combined with June FOMC reaffirming hawkish April stance validates no 2026 rate cuts scenario driving gold toward $4,450-4,300 major support zone representing additional 4-7% downside from current levels (Probability: medium)
Primary opportunity: Fed softens hawkish April tone at June meeting suggesting data-dependent flexibility triggers dollar reversal from current 98.2 level supporting gold recovery toward $4,800-4,900 resistance within 3-4 weeks as rate cut expectations resurface (Timeframe: Next 3-6 weeks through June 17 FOMC and into early July as market digests whether April hawkish guidance represents regime shift or temporary pause in easing trajectory)
This week's edge: Market may be underestimating significance of Q1 central bank demand holding at 244t (+3% YoY) versus widely-discussed March ETF outflows, suggesting structural bid floor at $4,450-4,600 remains intact; however, three consecutive missed calls indicate desk lacks clear informational edge in current environment and timing of any bullish counter-positioning requires confirmation that April FOMC hawkish guidance was peak hawkishness rather than new baseline
Volatility Context
At the 78th percentile of its 90-day range, gold price volatility is running hot, creating both opportunity and risk for directional traders. Realised vol is declining steadily, compressing into ranges that tend to snap when a catalyst breaks the equilibrium.
Elevated volatility at 78th percentile requires wider stops with daily ranges potentially 2.5-3.5% versus normal 1.5-2%; current $4,600-4,750 consolidation zone suggests breakouts become more reliable once volatility normalizes below 70th percentile by late May, but until then price action subject to elevated noise and false signal risk
Week Ahead Outlook
The next major catalyst is Federal Reserve FOMC Meeting decision with market assessing whether April hawkish guidance represents new baseline or temporary positioning ahead of potential mid-year rate cut resumption on Wednesday 17 June — a high-impact event that could materially shift the directional picture.
For GC futures, the balance between existing momentum and scheduled risk events sets the stage for the week ahead.
This analysis covers one dimension. Our full weekly report combines six specialist agents into a single actionable briefing with directional bias, key levels, and risk-opportunity matrix.
Start Free — Get the Market of the WeekFree weekly report · No credit card · Upgrade anytime


