Gold Forecast This Week — Outlook, Drivers & Key Levels
This week's Gold outlook: key drivers, volatility context, risk-opportunity assessment and the week ahead.

Current Market Picture
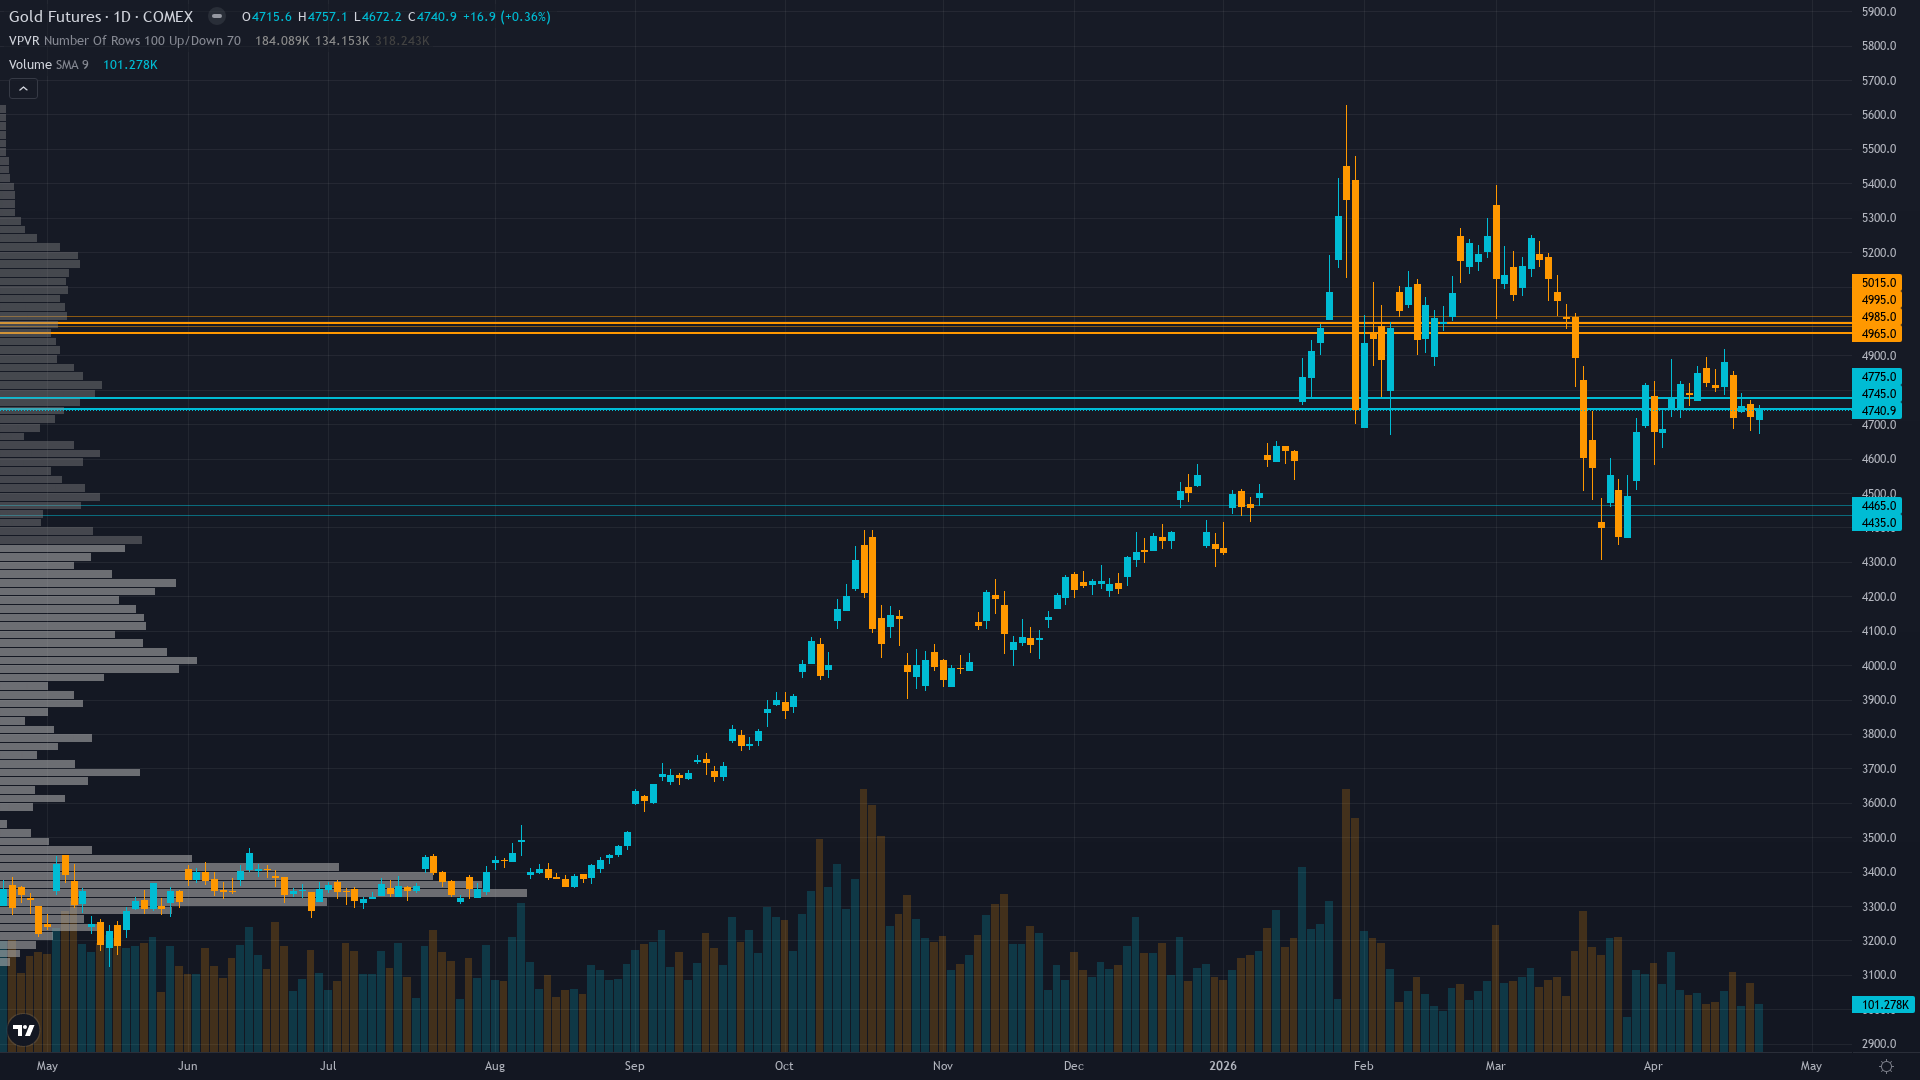
gold sits at 4740.9 after a 0.36% gain — a quiet move higher without aggressive momentum. The market in gold futures is coiling, with narrowing price ranges suggesting stored energy that will eventually release.
Mixed with FOMC hold widely priced at 99.5% probability but forward guidance uncertainty elevated, institutional targets remaining at $5,000-5,400 while near-term consolidation at $4,700-4,800 creates binary breakout/breakdown setup dependent on Fed communication
Key Drivers This Week
Primary driver: Gold consolidating at $4,741 in pre-FOMC holding pattern with April 28-29 meeting priced at 99.5% hold creating no fresh catalyst while two consecutive missed calls have degraded thesis credibility requiring tactical reset
Secondary factor: Technical recovery stalling with price 3.6% below 50-day MA at $4,912 after brief bounce attempt from April lows, RSI neutral at 53.84 showing no directional conviction as market awaits FOMC guidance on higher-for-longer trajectory
Additional influence: Central bank demand showing mixed signals with February rebound to 27 tonnes after January collapse but still below 2025 pace while elevated real yields around 1.94% create persistent structural headwind offsetting institutional targets of $5,000-5,400
Economic backdrop: FOMC meeting April 28-29 priced at 99.5% hold at 3.50-3.75% per CME FedWatch with forward guidance critical for rate cut timeline, DXY at 98.53 mid-range providing neutral dollar backdrop, VIX at 19.50 below 20 threshold indicating normalized equity risk conditions
Fundamental assessment: Modestly undervalued at $4,741 versus institutional targets $5,000-5,400 from Goldman Sachs and JPMorgan but March CPI spike to 3.3% YoY created higher-for-longer Fed trajectory with real yields elevated at 1.94% offsetting structural central bank demand of 800-1,000t annually
Price Structure
Consolidating at $4,741 in $4,670-4,800 range following 8% bounce from April 13 low of $4,658, price remains below broken 50-day MA at $4,912 with RSI neutral at 53.84, momentum directionless as MACD near zero line shows lack of conviction
Trend strength at 5/10 paints a picture of a market with some direction but lacking strong conviction.
Upside & Downside
Primary risk: FOMC maintains hawkish higher-for-longer guidance at April 28-29 meeting validating March CPI spike as trend rather than transitory, driving dollar strength above DXY 100 and pushing gold toward $4,400-4,450 major support zone representing additional 5-7% downside (Probability: medium)
Primary opportunity: FOMC introduces dovish optionality suggesting March CPI spike was transitory, triggering dollar reversal from current DXY 98.5 level and supporting gold rally back toward $4,900-5,000 resistance zone within 2-3 weeks as rate cut expectations resurface (Timeframe: Next 2-3 weeks through April 29 FOMC and into mid-May as market digests whether consolidation at $4,700-4,800 represents base-building for recovery or distribution before renewed decline)
This week's edge: Resetting after 2 consecutive misses - thesis credibility degraded and FOMC catalyst is widely priced leaving minimal information edge in current consolidation range until forward guidance provides fresh directional signal Wednesday April 29
Volatility Context
At the 78th percentile of its 90-day range, gold price volatility is running hot, creating both opportunity and risk for directional traders. Realised vol is declining steadily, compressing into ranges that tend to snap when a catalyst breaks the equilibrium.
Elevated volatility at 78th percentile requires wider stops with daily ranges potentially 2.5-3.5% versus normal 1.5-2%; current $4,670-4,800 consolidation zone suggests breakouts become more reliable once volatility normalizes post-FOMC below 70th percentile, but until then price action subject to elevated noise
Week Ahead Outlook
The next major catalyst is Federal Reserve FOMC Meeting statement and Powell press conference with 99.5% probability of hold at 3.50-3.75% range, forward guidance on rate cut timeline critical after March inflation spike eliminated near-term easing expectations on Wednesday 29 April — a high-impact event that could materially shift the directional picture.
For GC futures, the balance between existing momentum and scheduled risk events sets the stage for the week ahead.
This analysis covers one dimension. Our full weekly report combines six specialist agents into a single actionable briefing with directional bias, key levels, and risk-opportunity matrix.
Start Free — Get the Market of the WeekFree weekly report · No credit card · Upgrade anytime


