EUR/USD Key Levels This Week — Support, Resistance & Confluence Zones
EUR/USD key levels breakdown: support zones, resistance zones, confluence and price structure.

Structural Assessment
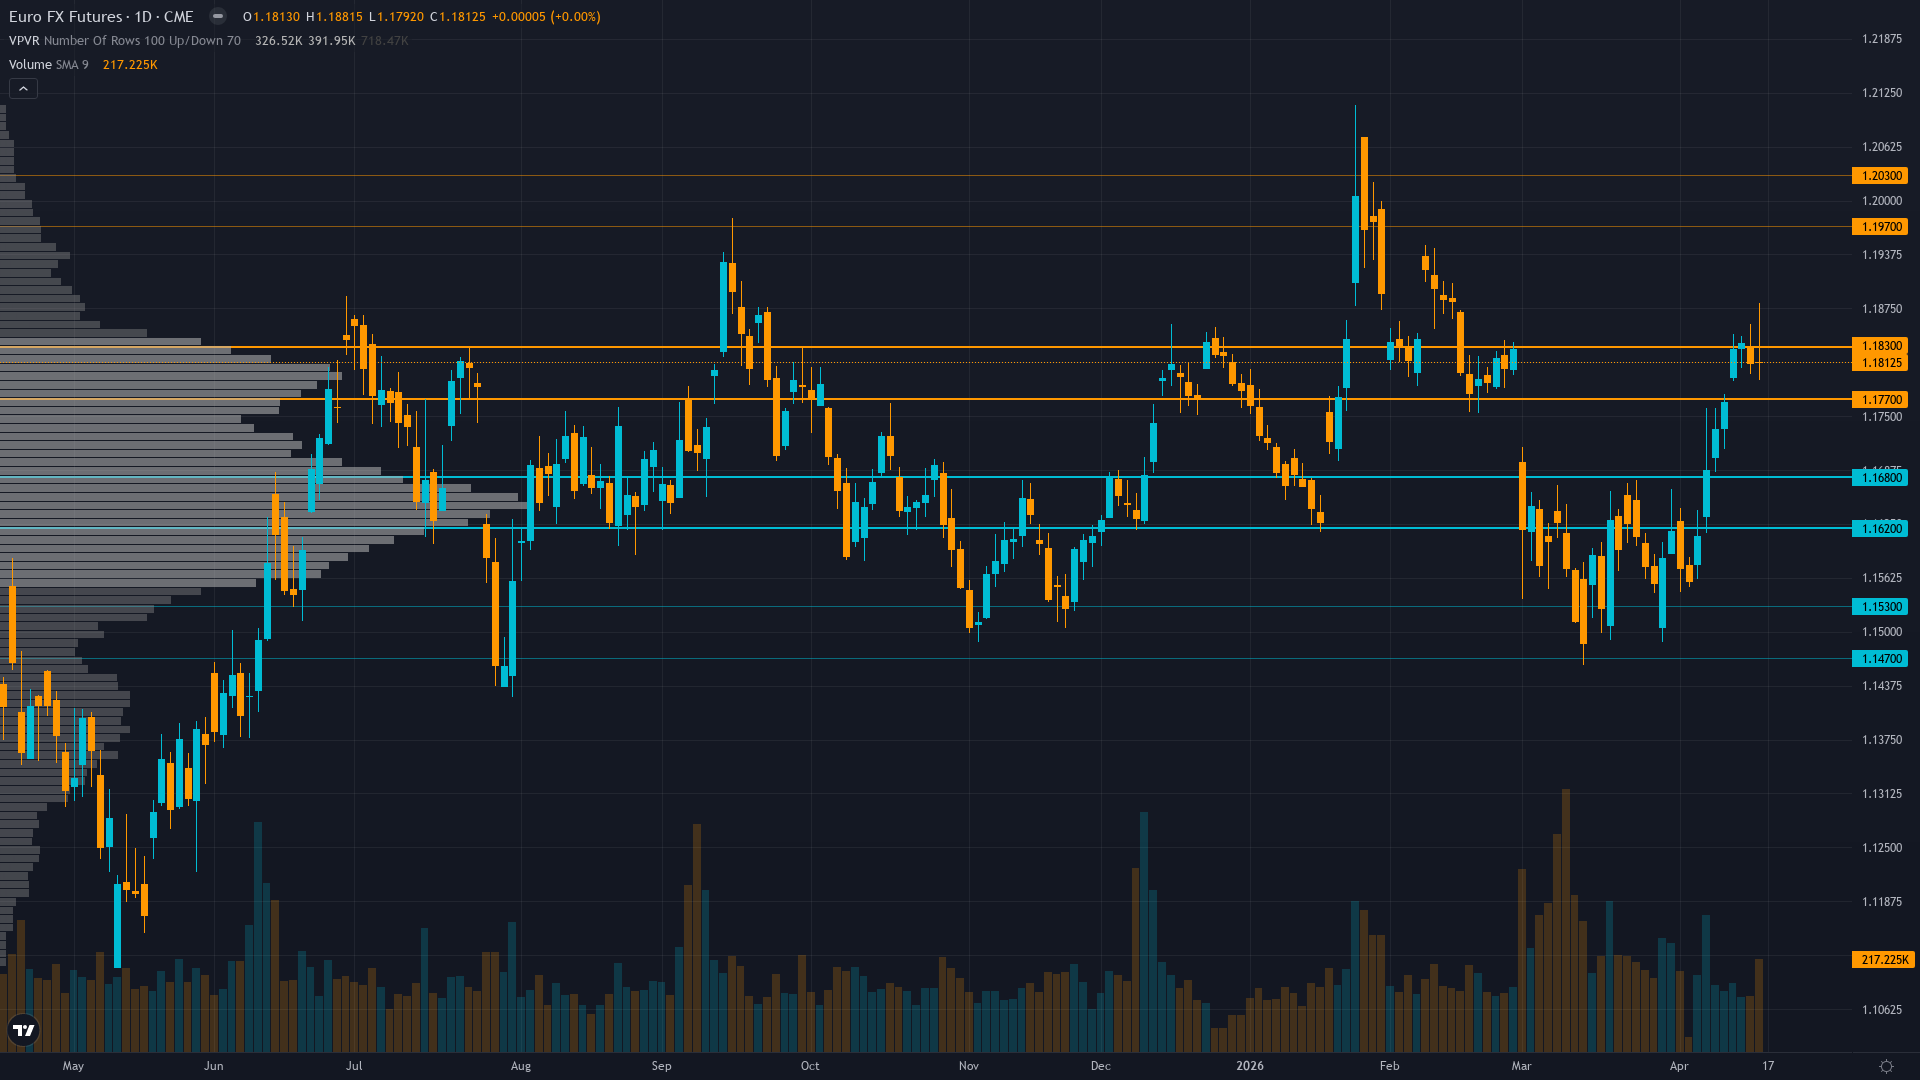
Trading at 1.1807 with a 0.26% uptick, EUR/USD is drifting higher without strong conviction. euro dollar is consolidating, with price compressing into a narrower range as the market builds energy for its next move.
Trading at 1.1807 just above 200-day MA at 1.1670 but below 50-day MA at 1.1792, trapped in protracted consolidation range with RSI at 41.62 showing neutral momentum, eleven of twelve moving averages providing mixed signals reflecting choppy mean-reverting FX behavior
At 5/10, trend strength is middling — enough to suggest a lean, but not enough to trade with high confidence.
Support Architecture
Support levels for EUR/USD are defined by zones of prior institutional demand. The depth and frequency of prior tests at these levels determines their likely strength.
The strength of support depends on the current ranging regime and volume profile at each level.
Upside Barriers
Resistance levels above 6E futures current price represent zones of historical supply. The significance of each level scales with the number of prior tests and the volume traded there.
The current consolidating regime influences how aggressively these resistance zones are likely to be tested and whether they hold or fold.
Confluence & Methodology
Confluence is the differentiator between a line on a chart and a level worth trading. For euro dollar, the zones with the highest conviction are those validated across technical, institutional, and derivatives dimensions simultaneously.
Normal volatility environment suggests 60-80 pip daily ranges versus typical 100-120 pip ranges during elevated periods; breakouts from current 1.16-1.19 consolidation likely false signals until vol expands above 50th percentile post-ECB; favor mean reversion range strategies over directional positioning until April 30 catalyst provides clarity
Beyond Lines on a Chart
Our approach to key levels is designed to filter noise from signal. Six independent agents each assess the same price zones from different perspectives. A level confirmed by one discipline is interesting. A level confirmed by four or five is worth building a trade plan around.
This multi-discipline approach means the levels in our paid reports carry institutional-grade confluence — not just lines on a chart, but zones validated across every analytical dimension that matters.
Our paid reports include specific support and resistance levels identified by six specialist agents — technical structure, institutional positioning, options flow, fundamentals, sentiment, and economic analysis. Not just lines on a chart, but zones validated by multi-discipline confluence.
Start Free — Get the Market of the WeekFree weekly report · No credit card · Upgrade anytime


