Copper Forecast This Week — Outlook, Drivers & Key Levels
This week's Copper outlook: key drivers, volatility context, risk-opportunity assessment and the week ahead.

Current Market Picture
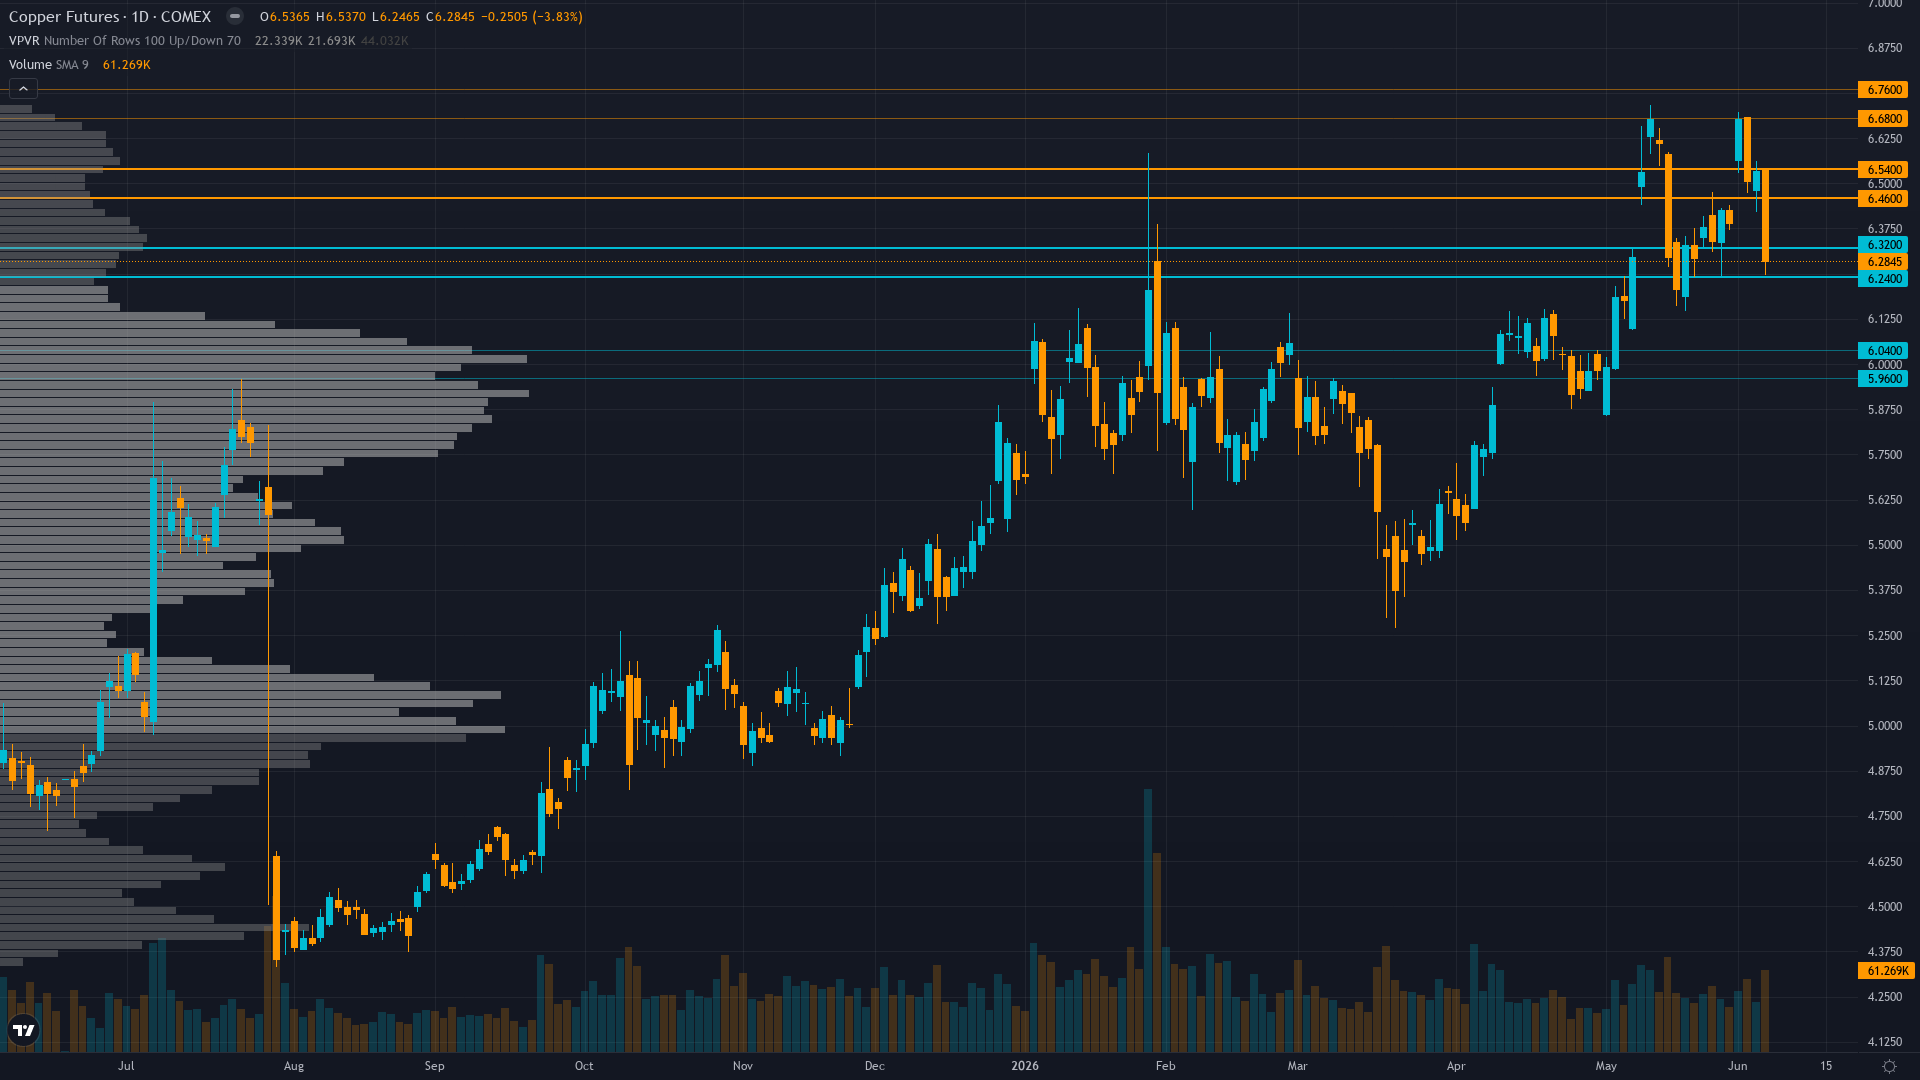
copper is trading at 6.28, down 3.97% as selling pressure weighs on price. copper futures is in a breaking down market state, requiring careful assessment of current conditions.
Copper consolidating from January 2026 record highs with elevated prices expected but near-term breakdown from $6.54 to $6.28 creating technical damage and uncertainty as market balances structural supply deficit against demand mixed signals, Section 232 tariff policy uncertainty, and elevated positioning at 5-month highs creating tactical vulnerability
Risk & Opportunity
Primary risk: June 6-7 breakdown represents failed breakout pattern triggering cascading technical selling if $6.15 mid-May support breaks, validating that 7-week consolidation from January $6.72 highs was distribution not continuation, with managed money positioning at 5-month high of 73K creating forced liquidation risk despite unchanged Grasberg supply fundamentals (Probability: high)
Primary opportunity: Oversold bounce from $6.28 breakdown level if structural supply deficit reasserts via June 30 Commerce tariff confirmation at 25%+ validating hoarding incentive, or if China June PMI surprises above 50.5 confirming manufacturing resilience offsetting current demand uncertainty, with contrarian setup emerging as breakdown washout clears weak positioning (Timeframe: 1-3 weeks as June 17 FOMC and June 30 Commerce tariff review create binary catalyst windows, though technical damage requires $6.15 support hold to validate continuation case versus breakdown acceleration toward $5.72 major support representing 9% further decline)
This week's edge: Market experiencing severe technical breakdown on June 6-7 (3.83% decline breaking $6.30 support) despite unchanged structural fundamentals from Grasberg offline and sulfuric acid ban, creating fundamental-technical schism where desk at conviction floor of 5 acknowledges price action currently overriding supply deficit narrative until June 30 Commerce tariff decision or China June PMI resolves demand trajectory, with $6.15 mid-May support representing critical line in the sand for trend continuation versus acceleration toward $5.72 major support
What's Driving Price
Primary driver: Technical breakdown on June 6-7 from $6.54 to $6.28 (-3.83%) breaking critical $6.30 support level on elevated volume, overriding structural supply deficit fundamentals as failed breakout pattern triggers distribution phase
Secondary factor: Section 232 tariff proclamation issued June 1, 2026 modifying copper import regime creates policy uncertainty despite Fundamental agent projection of 25%+ tariff supportive thesis, with June 30 Commerce review still pending as critical catalyst
Additional influence: VIX spiked to 21.51 on June 5 (from 15.40 baseline) signaling acute risk-off episode coinciding with copper breakdown, though managed money positioning at 73.0K contracts (down from 76.3K May peak) shows early profit-taking not panic liquidation
Economic backdrop: Fed on hold with 99% probability for June 17-18 meeting, DXY at 100.07 showing modest USD strength creating commodity headwind, China PMI at 50.0 barely expansionary, US ISM Manufacturing at 54.0 solid but 6-day-old data, no fresh China data this week limiting demand validation
Fundamental assessment: Structural supply deficit intact with Grasberg offline through Q2 2026, El Teniente production-depressed, and treatment charges at -$66.40/t signaling concentrate shortage, but near-term price action suggests demand elasticity emerging at elevated levels as market reprices away from scarcity premium despite Goldman 600,000t deficit vs ICSG 96,000t surplus creating analytical confusion
Chart Assessment
Daily trend broken decisively below $6.30 consolidation shelf after opening June 6 at $6.54 and collapsing to $6.28, testing mid-May breakout support at $6.15 which represents line in the sand for May uptrend validity, 52-week range $4.33-$6.72 placing current $6.28 at 82nd percentile but momentum deteriorating rapidly
With trend strength at only 3/10, any directional bias is thin and easily disrupted.
Volatility Context
At the 72th percentile of its 90-day range, copper price volatility is running hot, creating both opportunity and risk for directional traders. Realised vol is trending higher across the curve, which tends to accompany transitional periods where the market is repricing risk.
Current 35.2% short-term volatility suggests daily ranges of 3-4% versus normal 1.5-2% for copper, June 6-7 breakdown showing acceleration not exhaustion with elevated volume (61.27K) indicating distribution phase, fresh technical deterioration plus institutional positioning at 5-month high creates high-probability continuation setup near-term before stabilization at $6.15 or $5.72 support levels
Seasonal Patterns
Seasonality is a non-factor for COMEX copper this month, with a 50% historical win rate offering no edge. Mid-year demand plateau.
Looking Forward
All eyes turn to FOMC decision June 17-18 (99% priced for hold but dot plot and policy statement could shift dollar trajectory) and China June PMI release end-month representing critical demand validation for 50% global consumer on Wednesday 17 June, which carries enough weight to force a decisive directional move.
The week ahead for copper price hinges on whether the prevailing breaking down regime can absorb the scheduled catalysts without a regime shift.
This analysis covers one dimension. Our full weekly report combines six specialist agents into a single actionable briefing with directional bias, key levels, and risk-opportunity matrix.
Start Free — Get the Market of the WeekFree weekly report · No credit card · Upgrade anytime


