Copper Forecast This Week — Outlook, Drivers & Key Levels
This week's Copper outlook: key drivers, volatility context, risk-opportunity assessment and the week ahead.

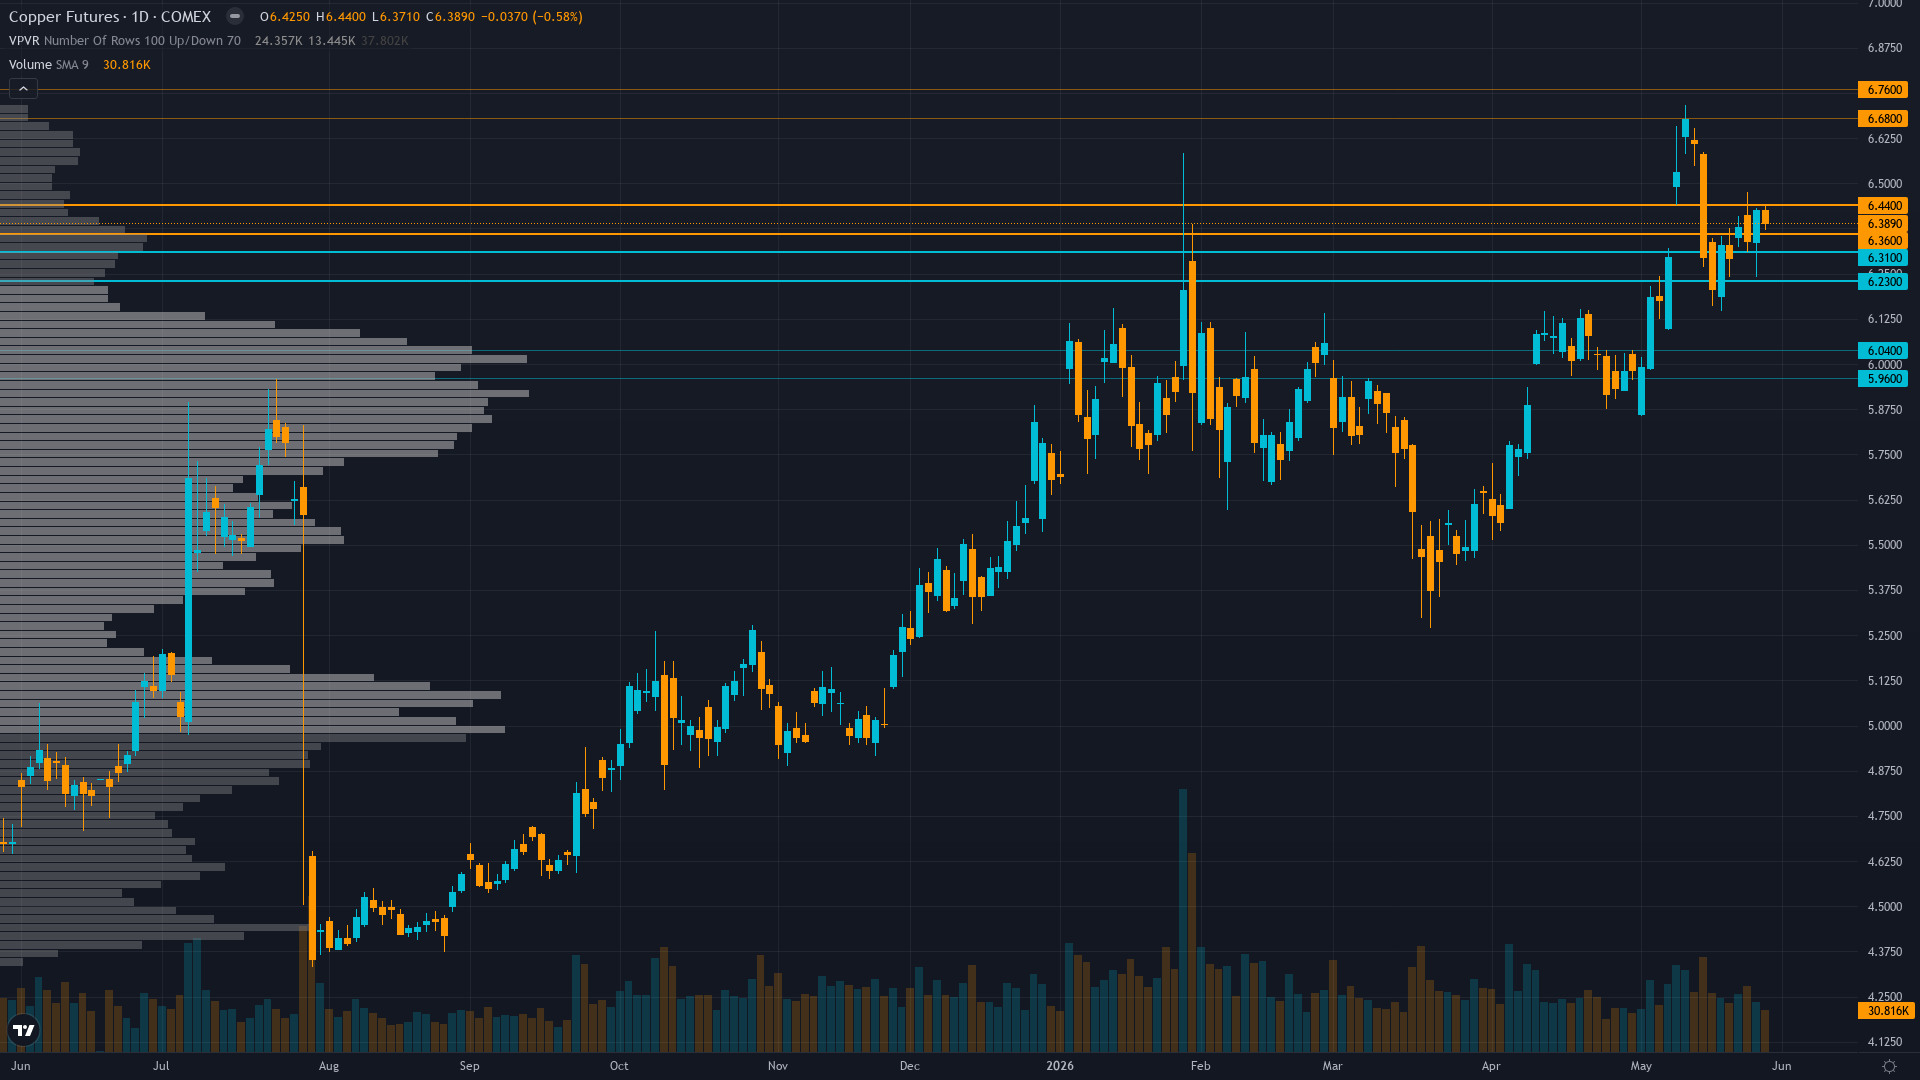
Current Market Picture
copper sits at 6.42 after slipping 0.09% — a shallow pullback rather than a decisive move. The market in copper futures is coiling, with narrowing price ranges suggesting stored energy that will eventually release.
Copper consolidating from January 2026 record highs with elevated prices expected to persist supported by structural supply deficit fundamentals but near-term volatility likely as market balances US manufacturing strength against China demand mixed signals and institutional positioning at 5-month highs creating tactical uncertainty
Key Drivers This Week
Primary driver: US Manufacturing PMI sustained at 55.3 (4-year high released May 2026) representing FRESH demand acceleration catalyst validating manufacturing floor despite China mixed signals, while structural supply deficit from Grasberg mine offline through Q2 2026 and sulfuric acid export ban affecting 15% of global production remains intact
Secondary factor: Managed money net-long positioning at 71,974 contracts (week ended May 19) represents 5-month high but remains at moderate 70th-75th percentile creating residual chase potential rather than crowding extreme, while China state reserve expansion provides structural bid support
Additional influence: Price at $6.42/lb trading 4.5% below January $6.72 all-time high within controlled consolidation pattern, holding above 50-day MA with RSI 59-60 showing positive momentum without overbought extremes as June-July seasonal construction restocking cycle approaches
Economic backdrop: Fed on hold at 3.50-3.75% range with no rate cuts expected until late 2026, US Manufacturing PMI at 55.3 (May 2026, strongest since May 2022) validating manufacturing expansion floor, China PMI mixed at 50.3 showing tepid growth, VIX 17.44 below 20 threshold confirming RISK-ON conditions with benign macro regime supporting cyclical commodities
Fundamental assessment: Structural supply deficit materializing with Grasberg offline through Q2 2026 removing 525k-600k tons and China sulfuric acid export ban affecting 15% of global mining, current $6.42/lb (~$14,150/mt) trading near JPMorgan $12,500/mt Q2 target validating fair valuation, though LME inventories at 393,400 tonnes with available stock tight at 89,725t creates analytical tension between headline abundance and true physical tightness
Price Structure
Daily uptrend intact above 50-day MA (~$5.85-5.90) and 200-day MA (~$5.25-5.35) with current $6.42 consolidating 4.5% below January $6.72 52-week high, RSI 59-60 showing positive momentum without overbought extremes, 52-week range $4.33-$6.72 placing current at 88th percentile
Trend strength sits at 6/10, reflecting a market that has directional bias but hasn't reached extreme conviction.
Upside & Downside
Primary risk: China June PMI (released late June/early July) disappointing below 50 expansion threshold confirming Q1-Q2 import weakness represents structural demand deterioration rather than logistics noise, validating that manufacturing PMI strength has not translated to broader copper consumption and triggering extended profit-taking from elevated positioning at 5-month highs (Probability: medium)
Primary opportunity: US ISM Manufacturing PMI June 3 confirming S&P Global 55.3 preliminary reading validates manufacturing expansion acceleration while June-July seasonal construction restocking (historically 75% success rate) combines with Grasberg supply shock persisting through Q2 2026 and JPMorgan $12,500/mt Q2 target, driving breakout through $6.50 psychological resistance toward January $6.72 highs as deficit reality forces market repricing (Timeframe: 2-6 weeks as June 3 ISM Manufacturing validates PMI strength, June-July seasonal tailwinds materialize into Northern Hemisphere summer construction peak, and institutional positioning at 70th-75th percentile creates forced chase dynamic if supply deficit narrative reasserts dominance over demand uncertainty)
This week's edge: Market may be overweighting that managed money positioning reached 5-month high of 71,974 contracts (May 19) as crowding risk signal while underweighting that 70th-75th percentile positioning represents moderate not extreme levels leaving chase potential, available LME inventory excluding warrants critically tight at 89,725 tonnes contradicts headline 393,400t stock narrative, US Manufacturing PMI 55.3 (4-year high) represents FRESH demand catalyst from May 2026 validating floor despite China mixed signals, and June-July seasonal construction restocking shows 75% historical success rate into Northern Hemisphere summer peak creating asymmetric upside setup toward $6.50-6.72 resistance as June 3 ISM Manufacturing potentially triggers breakout
Volatility Context
At the 65th percentile, copper price volatility sits in a normal range, neither compressed enough to signal a breakout nor elevated enough to demand caution. Realised vol is holding its current level, suggesting the market has found a temporary equilibrium in its risk pricing.
Current 28.5% short-term volatility (5-day) suggests daily ranges of 2-3% versus normal 1.5-2%, record high consolidation showing controlled price action rather than blow-off top characteristics with stable volatility ranges since April indicating digestion phase nearing completion ahead of June 3 catalyst event, supply-driven rallies historically more sustainable than monetary-driven moves creating confidence in trend continuation potential
Seasonal Patterns
Seasonality is a non-factor for COMEX copper this month, with a 52% historical win rate offering no edge. Demand stabilises at high levels.
Looking Forward
All eyes turn to US ISM Manufacturing PMI release for May 2026 representing critical confirmation of S&P Global preliminary 55.3 reading and validating manufacturing demand resilience hypothesis on Wednesday 3 June, which carries enough weight to force a decisive directional move.
The week ahead for copper price hinges on whether the prevailing consolidating regime can absorb the scheduled catalysts without a regime shift.
This analysis covers one dimension. Our full weekly report combines six specialist agents into a single actionable briefing with directional bias, key levels, and risk-opportunity matrix.
Start Free — Get the Market of the WeekFree weekly report · No credit card · Upgrade anytime


