Copper Forecast This Week — Outlook, Drivers & Key Levels
This week's Copper outlook: key drivers, volatility context, risk-opportunity assessment and the week ahead.

This Week's Starting Point
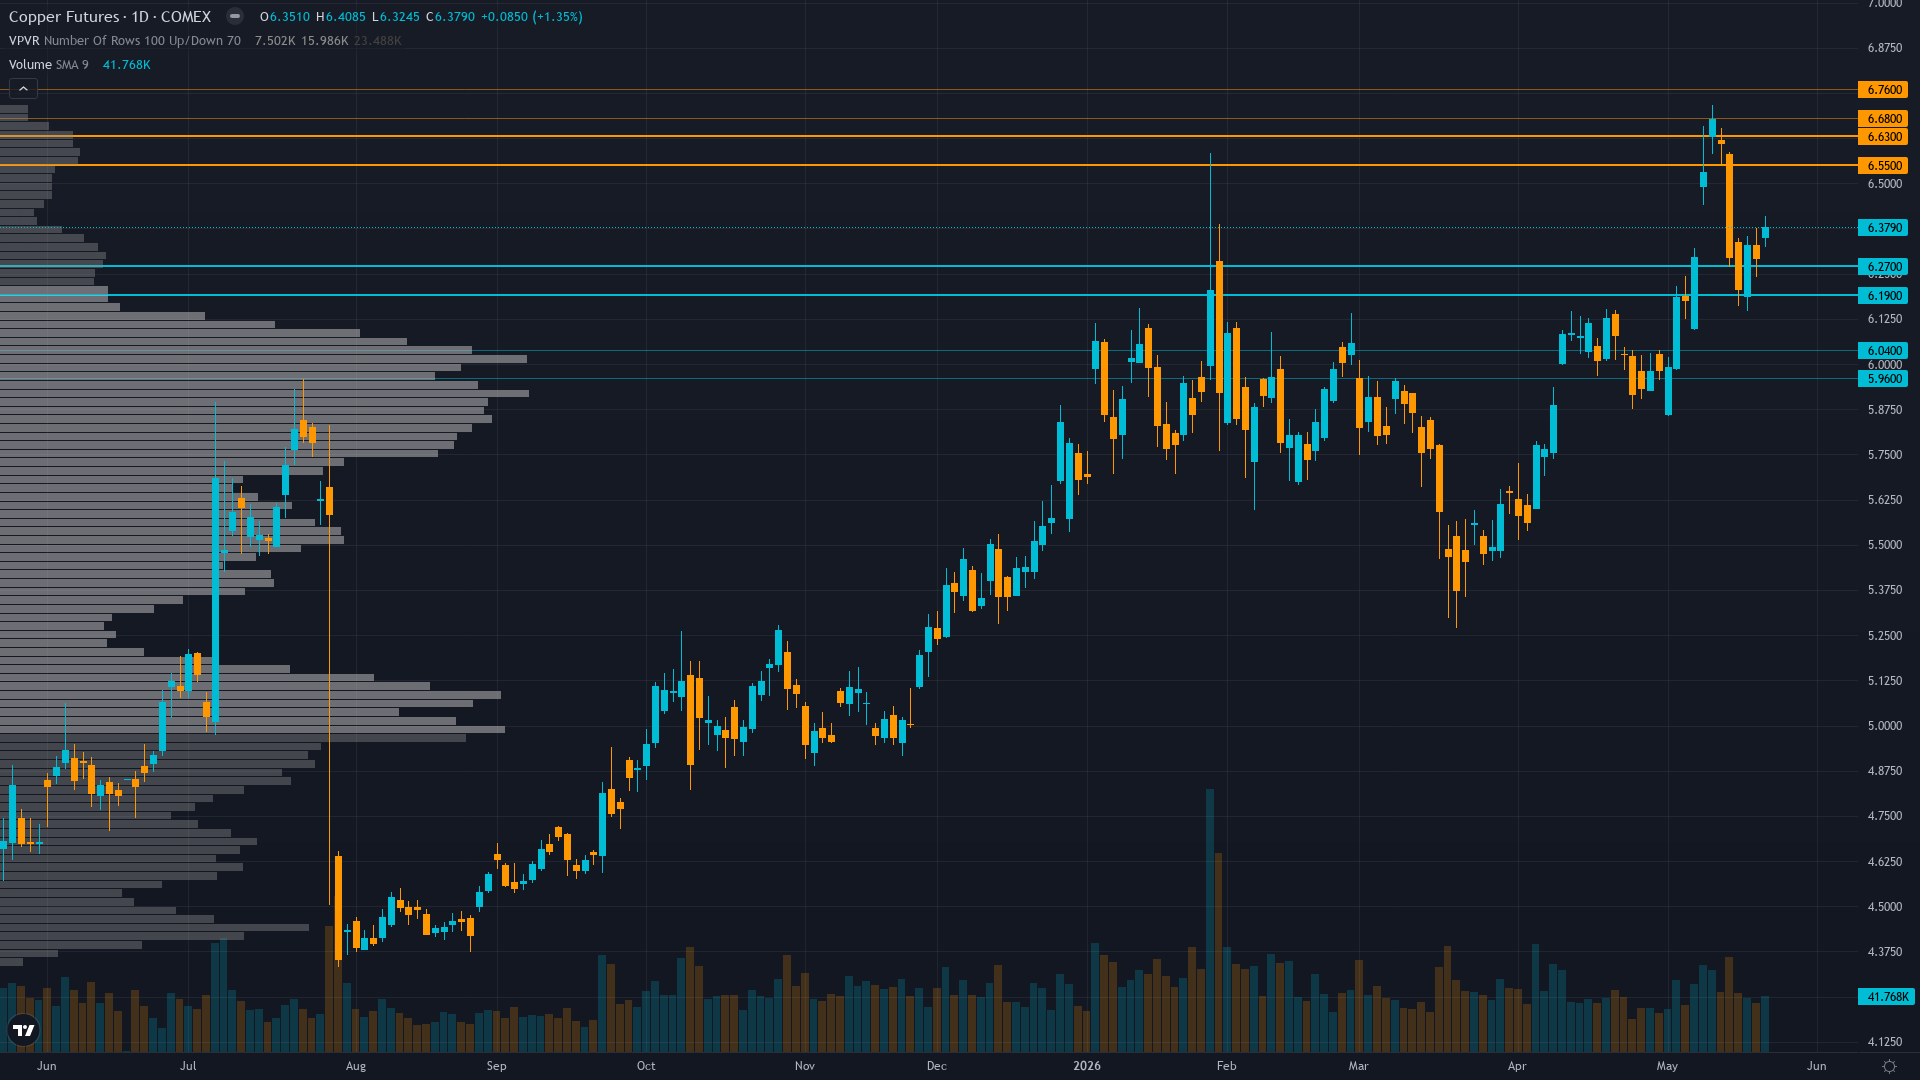
Trading at 6.32 with a 0.35% dip, copper is giving back ground gradually. Price action in copper futures has compressed into a consolidation pattern, typically a precursor to a directional breakout.
Copper consolidating from January 2026 record highs with elevated prices expected to persist supported by structural supply deficit fundamentals but near-term volatility likely as market balances US manufacturing acceleration against China demand mixed signals and positioning at 20-week highs creating tactical uncertainty
Forces in Play
Primary driver: US Manufacturing PMI surge to 55.3 (strongest since May 2022, released within 72 hours) creates fresh demand validation catalyst overriding structural supply deficit narrative from Grasberg mine offline through Q2 2026 and China sulfuric acid export ban affecting 15% of global mining
Secondary factor: Managed money net-long positioning at 73,523 contracts (20-week high per May 19 CFTC data) creates moderate crowding risk at current $6.32 level trading 5.9% below January $6.72 all-time high but institutional positioning still below historical extremes at 70th-75th percentile range
Additional influence: Fundamental valuation conflict emerging as May 24 agent signals +1.5/6 (modestly overvalued citing $10,710/tonne Goldman target vs current ~$13,930/mt) down sharply from May 17 +3.5/7.5 strongly bullish assessment showing rapid deterioration in fundamental conviction despite unchanged supply constraints
Economic backdrop: Fed on hold at 3.5%-3.75% range with May 21 FOMC minutes showing unprecedented 8-4 dissent vote signaling policy uncertainty ahead, US Manufacturing PMI surged to 55.3 in May (vs 54.5 April, consensus 53.8) strongest since May 2022, China Manufacturing PMI rose to 52.20 in April (vs 50.80 March) both validating manufacturing expansion but VIX at 16.70 indicates subdued volatility environment
Fundamental assessment: Critical shift: Fundamental agent downgraded from +3.5/7.5 BULLISH (May 17) to +1.5/6 mildly bullish (May 24) citing 5-10% overvaluation vs Goldman $10,710/tonne H1 target despite unchanged Grasberg supply shock and sulfuric acid export ban—market questioning whether structural deficit narrative justifies current $13,930/mt valuation amid demand uncertainty
Technical Landscape
Daily uptrend intact above 50-day MA (~$5.85-5.90) and 200-day MA (~$5.25-5.35) with current $6.32 consolidating 5.9% below January $6.72 52-week high, RSI 68-70 showing positive momentum without overbought extremes, 52-week range $4.33-$6.72 placing current at 83rd percentile leaving limited upside runway
Trend strength registers at 6/10, suggesting meaningful but not extreme directional bias.
Risk-Reward Assessment
Primary risk: China May PMI disappointing below 50 expansion threshold confirming that April's 52.20 reading was temporary peak not sustained recovery, validating Fundamental agent's May 24 valuation downgrade and triggering extended profit-taking from elevated +31% year-over-year price levels as positioning at 20-week highs creates forced liquidation risk (Probability: medium)
Primary opportunity: US Manufacturing PMI surge to 55.3 (May 2026, strongest in 4 years) represents FRESH demand catalyst not yet fully priced as Fundamental agent downgrade occurred BEFORE this data release, creating asymmetric setup if China May PMI validates expansion resilience above 50 driving breakout through $6.40 resistance toward January $6.72 highs as structural deficit reasserts dominance (Timeframe: 2-4 weeks as May-June seasonal strength pattern (historically 80% success rate into Northern Hemisphere spring construction restocking) materializes, early June China PMI validates manufacturing momentum, and Memorial Day holiday May 26 thin liquidity clears allowing directional move resolution)
This week's edge: Market may be overweighting Fundamental agent's May 24 valuation downgrade (5-10% overvaluation vs Goldman $10,710/mt target) while underweighting that US Manufacturing PMI surge to 55.3 in May (released within 72 hours, strongest since May 2022) represents FRESH demand acceleration catalyst not yet fully priced, creating moderate divergence from prevailing consolidation caution as May-June seasonal strength (80% historical success rate) and available LME inventory tightness (89,725 tonnes excluding warrants) contradict headline inventory build narrative
Risk Environment
With vol at the 72th percentile, copper price is trading in an elevated regime where daily ranges can surprise even experienced traders. Volatility is expanding, with realised vol rising across timeframes. This typically signals increasing uncertainty and wider daily ranges ahead.
Current 35.2% short-term volatility suggests daily ranges of 3-4% versus normal 1.5-2% for copper, consolidation at 83rd percentile of 52-week range with inverted vol structure indicates market awaiting catalyst rather than building conviction, Memorial Day thin liquidity May 26 plus early June China PMI creates binary catalyst window within 5-10 trading days where elevated vol either resolves bullish toward $6.72 resistance or corrects toward $6.00 support
Seasonal Context
Historical seasonal patterns for COMEX copper offer no strong directional signal in May 2026 (52% win rate). Demand stabilises at high levels.
Week Ahead Outlook
The next major catalyst is China May Manufacturing PMI release (typically end-month) representing critical demand validation for world's 50% copper consumer after recent fundamental conviction deterioration on Monday 1 June — a high-impact event that could materially shift the directional picture.
For copper, the balance between existing momentum and scheduled risk events sets the stage for the week ahead.
This analysis covers one dimension. Our full weekly report combines six specialist agents into a single actionable briefing with directional bias, key levels, and risk-opportunity matrix.
Start Free — Get the Market of the WeekFree weekly report · No credit card · Upgrade anytime


