Copper Forecast This Week — Outlook, Drivers & Key Levels
This week's Copper outlook: key drivers, volatility context, risk-opportunity assessment and the week ahead.

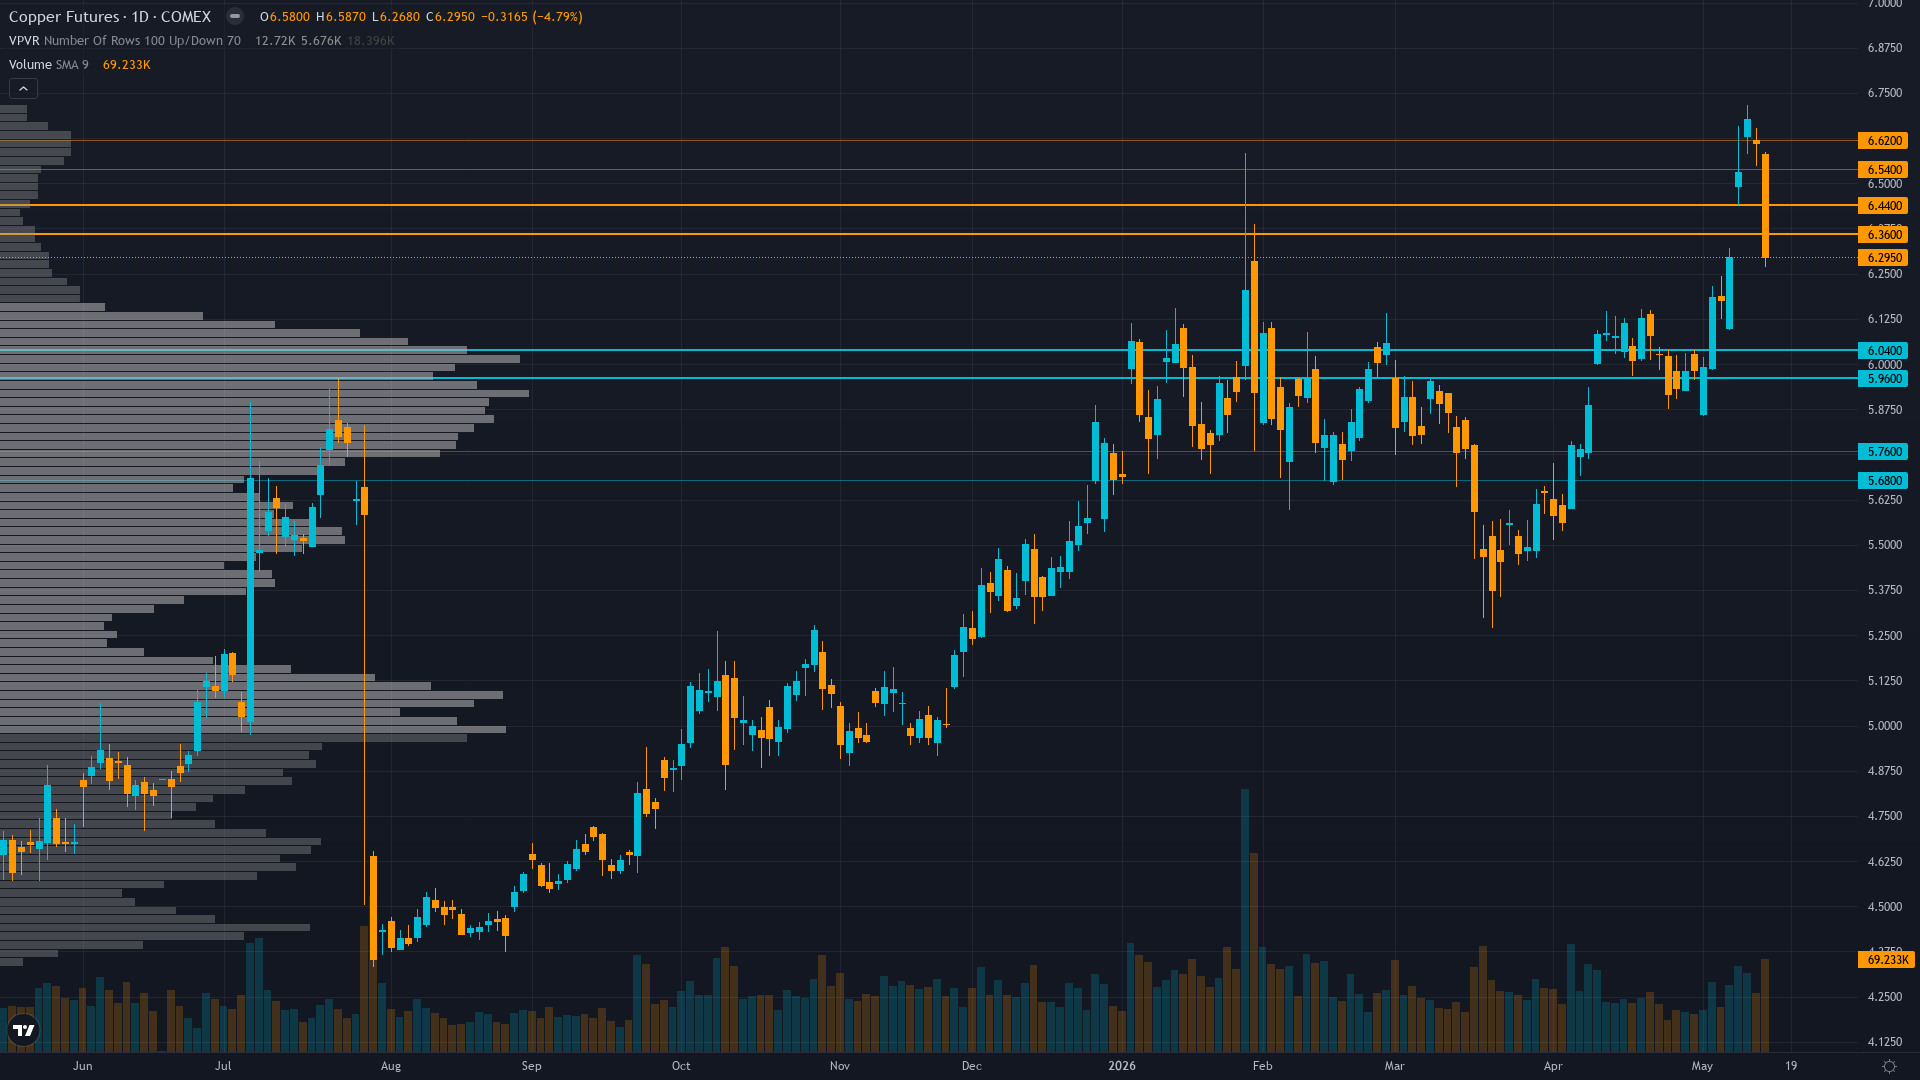
This Week's Starting Point
copper is trading at 6.27, down 4.79% as selling pressure weighs on price. copper futures is in a breaking down market state, requiring careful assessment of current conditions.
Copper consolidating from January 2026 record highs with elevated prices expected to persist but near-term volatility increasing as market balances structural supply deficit fundamentals against technical breakdown and demand uncertainty
Forces in Play
Primary driver: Sharp May 15 breakdown with 5.12% single-day decline from $6.61 to $6.23 breaking critical technical support and triggering elevated volume sell-off despite unchanged structural supply deficit from Grasberg mine remaining offline through Q2 2026
Secondary factor: Technical deterioration severe with price breaking below $6.30 consolidation shelf after RSI collapse to 35.11 and elevated volume (40,431 contracts vs typical 69K) signaling distribution phase not healthy digestion
Additional influence: Fundamental-technical divergence widening as top-weighted Fundamental agent maintains +3.5/7.5 BULLISH on supply deficit but Technical agent flips -2.0/6 BEARISH on price action, creating analytical paralysis at conviction floor
Economic backdrop: Fed on hold at 3.5-3.75% range with next meeting approaching, China April PMI 52.2 (5-year high released April 30 now 17 days old) provides stale demand validation, VIX 18.43 below 20 threshold indicating risk-on conditions despite copper-specific weakness
Fundamental assessment: Structural supply deficit intact with Grasberg offline through Q2 2026 removing 525k-600k tons and China sulfuric acid export ban affecting 15% of global mining, but near-term price action suggests demand weakness overwhelming supply tightness narrative creating valuation uncertainty
Technical Landscape
Daily trend broken below $6.30 consolidation zone with May 15 sharp decline on elevated volume, RSI 35.11 neutral-oversold, price 6.5% below January $6.72 all-time high and testing critical $6.23 support, 52-week range $4.33-$6.72 placing current at 70th percentile
Trend strength sits at 4/10, reflecting moderate directional pressure without clear dominance.
Risk-Reward Assessment
Primary risk: May 15 breakdown represents failed consolidation pattern triggering cascading long liquidation from elevated positioning (73,523 contracts 20-week high) as structural supply deficit narrative fails to support price despite unchanged fundamentals, validating that demand destruction from China overwhelms scarcity premium (Probability: medium)
Primary opportunity: May 15 decline creating oversold technical setup at $6.23 support with RSI 35.11 approaching bounce zone while structural fundamentals unchanged (Grasberg offline, sulfuric acid ban, LME inventory tight at available 89k tons), institutional positioning washout potentially clearing path for Q2 seasonal strength if China May PMI validates manufacturing resilience (Timeframe: 1-3 weeks as technical oversold conditions mature, month-end rebalancing flows approach May 31, and May 29 China PMI catalyst potentially triggers short-covering rally if demand validates above 50 expansion)
This week's edge: Market experiencing severe technical breakdown on May 15 (5.12% decline to $6.23) despite unchanged structural fundamentals (Grasberg offline, sulfuric acid ban), creating analytical paralysis between top-weighted Fundamental BULLISH view and Technical BEARISH reality—stepping aside at conviction floor of 5 until May 29 China PMI resolves whether demand destruction genuine or technical washout, acknowledging price action currently overriding fundamental scarcity narrative
Risk Environment
With vol at the 72th percentile, copper price is trading in an elevated regime where daily ranges can surprise even experienced traders. Volatility is expanding, with realised vol rising across timeframes. This typically signals increasing uncertainty and wider daily ranges ahead.
Current 35.2% short-term volatility suggests daily ranges of 3-4% versus normal 1.5-2%, May 15 breakdown showing acceleration not exhaustion with elevated volume indicating position liquidation, fresh technical deterioration plus institutional positioning at 20-week high creates high-probability continuation setup near-term before stabilization
Seasonal Context
Historical seasonal patterns for COMEX copper offer no strong directional signal in May 2026 (52% win rate). Demand stabilises at high levels.
Week Ahead Outlook
The next major catalyst is China May PMI release representing critical demand validation for world's 50% copper consumer after May 15 breakdown on Friday 29 May — a high-impact event that could materially shift the directional picture.
For copper, the balance between existing momentum and scheduled risk events sets the stage for the week ahead.
This analysis covers one dimension. Our full weekly report combines six specialist agents into a single actionable briefing with directional bias, key levels, and risk-opportunity matrix.
Start Free — Get the Market of the WeekFree weekly report · No credit card · Upgrade anytime


