Copper Forecast This Week — Outlook, Drivers & Key Levels
This week's Copper outlook: key drivers, volatility context, risk-opportunity assessment and the week ahead.

Where Things Stand
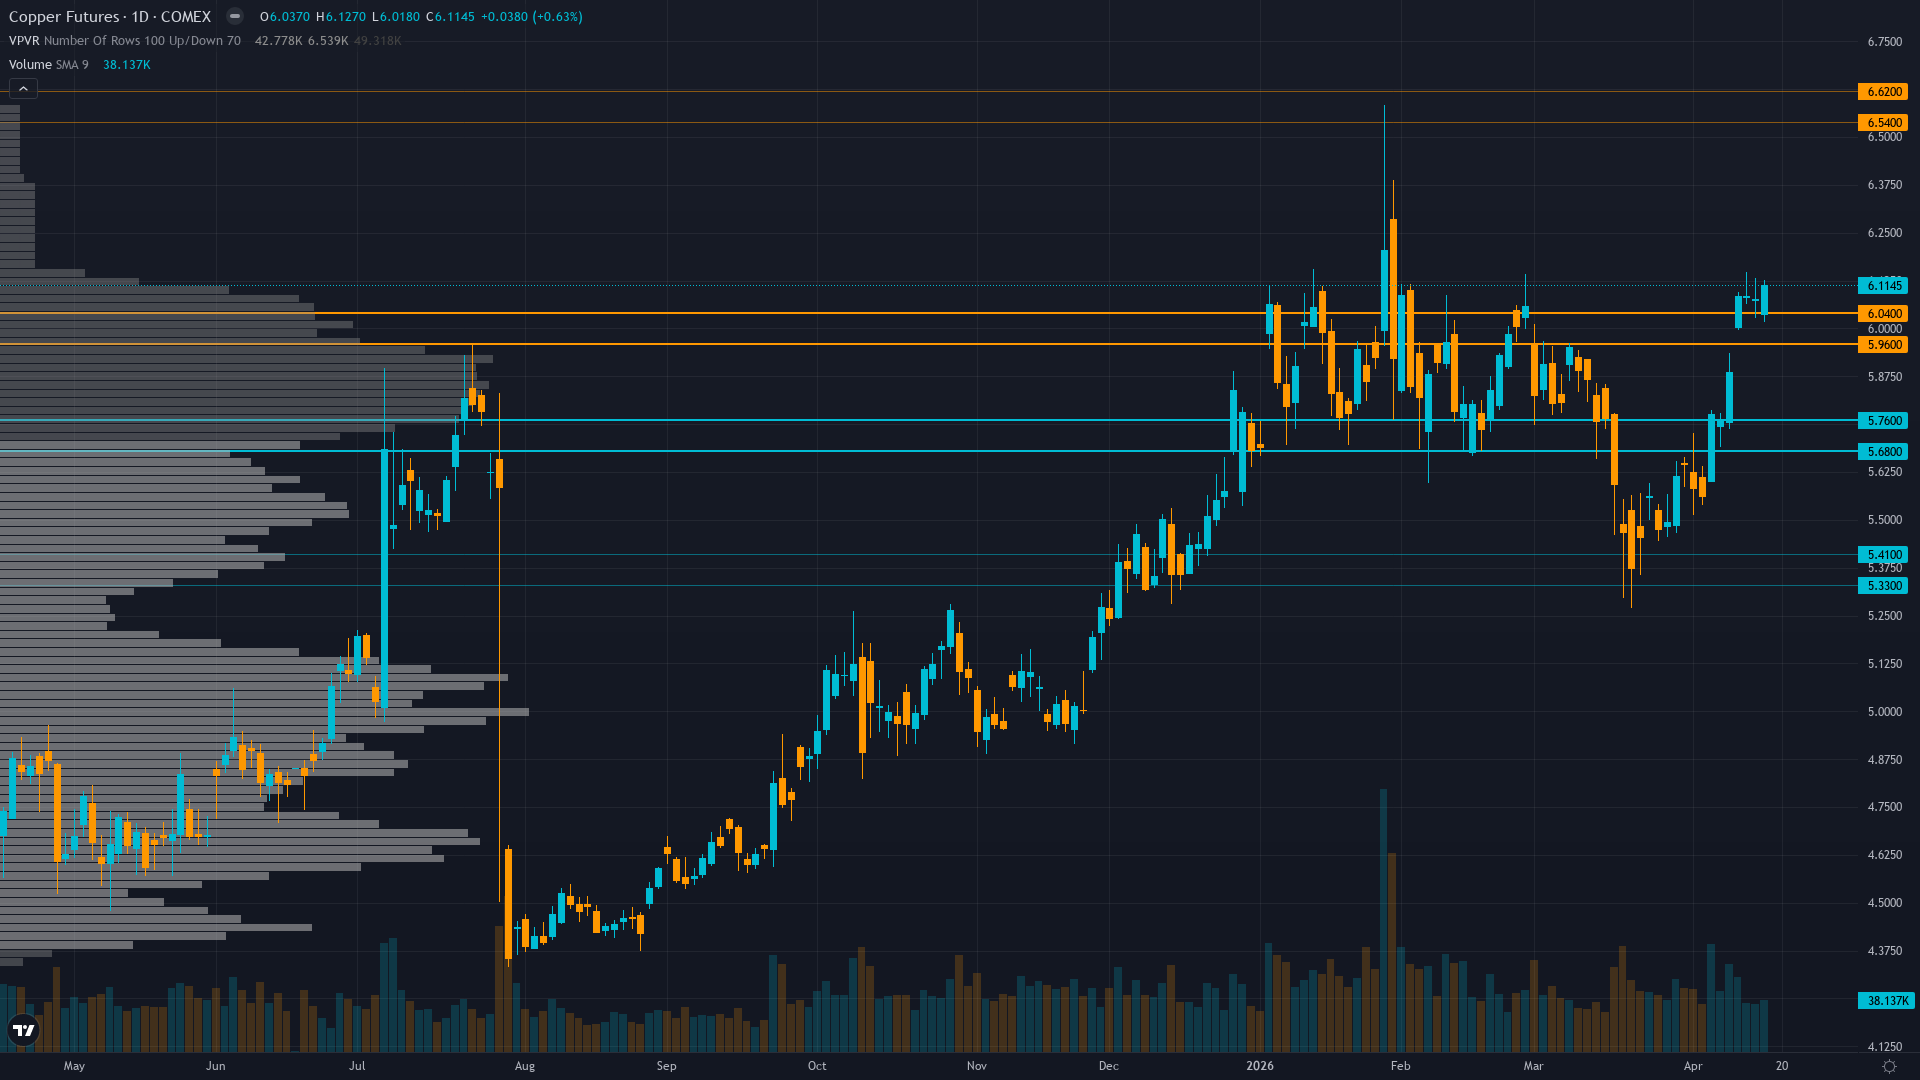
Trading at 6.1145 with a 0.62% uptick, copper is drifting higher without strong conviction. copper futures is consolidating, with price compressing into a narrower range as the market builds energy for its next move.
Copper elevated after spectacular 2025 rally with prices expected to remain supported by structural deficit narrative but near-term consolidation likely as market balances LME inventory 8-year highs against China demand mixed signals and downstream manufacturing resilience
What's Driving Price
Primary driver: Critical fundamental divergence: LME inventories at 400,625 tonnes (8-year high) and China March imports down 10.9% YoY creating supply-side bearish pressure contradicting technical uptrend and China infrastructure spending surge of 8.9% YoY (April 15 release)
Secondary factor: China copper foil operating rates exceeding 90.7% in April 2026 signaling downstream demand acceleration despite mixed PMI data (50.8 vs expectations), validating manufacturing floor hypothesis from Economic agent
Additional influence: Price at $6.1145 trading 29% above year-ago levels with VIX at 17.48 creating benign risk-on macro backdrop, but near-term consolidation from January $6.58 highs reflecting market digestion of conflicting fundamental signals
Economic backdrop: Fed on hold at 3.5-3.75% range with April 28-29 FOMC meeting approaching but no change expected, China March PMI 50.8 below expectations yet Q1 infrastructure spending +8.9% YoY creating mixed demand signals, VIX 17.48 supporting risk-on conditions
Fundamental assessment: Acute divergence between supply surplus evidence (LME stocks 8-year high, China imports -10.9% YoY March) and demand resilience signals (infrastructure +8.9% YoY, copper foil utilization >90.7%), creating 8-12% overvaluation per Fundamental agent versus structural deficit narrative
Chart Assessment
Daily uptrend intact above 50-day and 200-day MAs with RSI 68-70 approaching overbought territory, price +29% YoY but consolidating 7% below January record $6.58 high showing controlled digestion pattern
With trend strength at 6/10, there's a clear directional tilt but room for the move to develop further.
Risk & Opportunity
Primary risk: LME inventory build above 400,625 tonnes continuing while China April PMI disappoints below 50 threshold confirming March import weakness (-10.9% YoY) represents structural demand deterioration not temporary logistics, triggering extended profit-taking from elevated 29% YoY gain levels (Probability: medium)
Primary opportunity: China April PMI validating expansion above 50 while infrastructure spending momentum (Q1 +8.9%) and copper foil utilization (>90.7%) confirm downstream demand recovery offsetting inventory surplus narrative, driving breakout through $6.13 resistance toward January $6.58 highs as market reprices deficit reality (Timeframe: 2-4 weeks as April 29 China PMI catalyst materializes and seasonal April-May strength pattern (80% historical success rate) supports spring construction restocking cycle)
This week's edge: Market overweighting April 14 LME inventory surge to 400,625t (8-year high) and March China import decline -10.9% YoY as demand destruction signals while underweighting that available LME inventory excluding warrants remains critically tight, April 15 China infrastructure spending +8.9% YoY and copper foil operating rates >90.7% represent FRESH downstream demand acceleration not logistics noise, creating moderate divergence from prevailing cautious consolidation narrative with April 29 dual catalyst (FOMC + China PMI) potentially triggering directional resolution
Volatility Backdrop
copper price volatility at the 65th percentile reflects a balanced environment where standard risk parameters apply. Volatility remains anchored at current levels, with no clear signal of an imminent regime shift in either direction.
Current 28.5% short-term volatility (5-day) suggests daily ranges of 2-3% versus normal 1.5-2%, record high consolidation showing controlled price action rather than blow-off top characteristics with tightening ranges since mid-March indicating digestion phase nearing completion ahead of April 29 catalyst event, supply-driven rallies historically more sustainable than monetary-driven moves creating confidence in trend continuation potential
Historical Seasonal Bias
Seasonal analysis shows a historically bullish bias for COMEX copper in April 2026, with a 65% win rate. Peak demand season for industrial metals.
What to Watch
The Dual catalyst: FOMC decision (April 28-29) and China April PMI release (end of month) representing critical demand validation window on Wednesday 29 April stands as the week's primary risk event — high-impact and capable of overriding the existing technical and sentiment setup.
The interplay between consolidating market conditions and upcoming catalysts will define this week's trading landscape for HG futures.
This analysis covers one dimension. Our full weekly report combines six specialist agents into a single actionable briefing with directional bias, key levels, and risk-opportunity matrix.
Start Free — Get the Market of the WeekFree weekly report · No credit card · Upgrade anytime


