Copper Forecast This Week — Outlook, Drivers & Key Levels
This week's Copper outlook: key drivers, volatility context, risk-opportunity assessment and the week ahead.

This Week's Starting Point
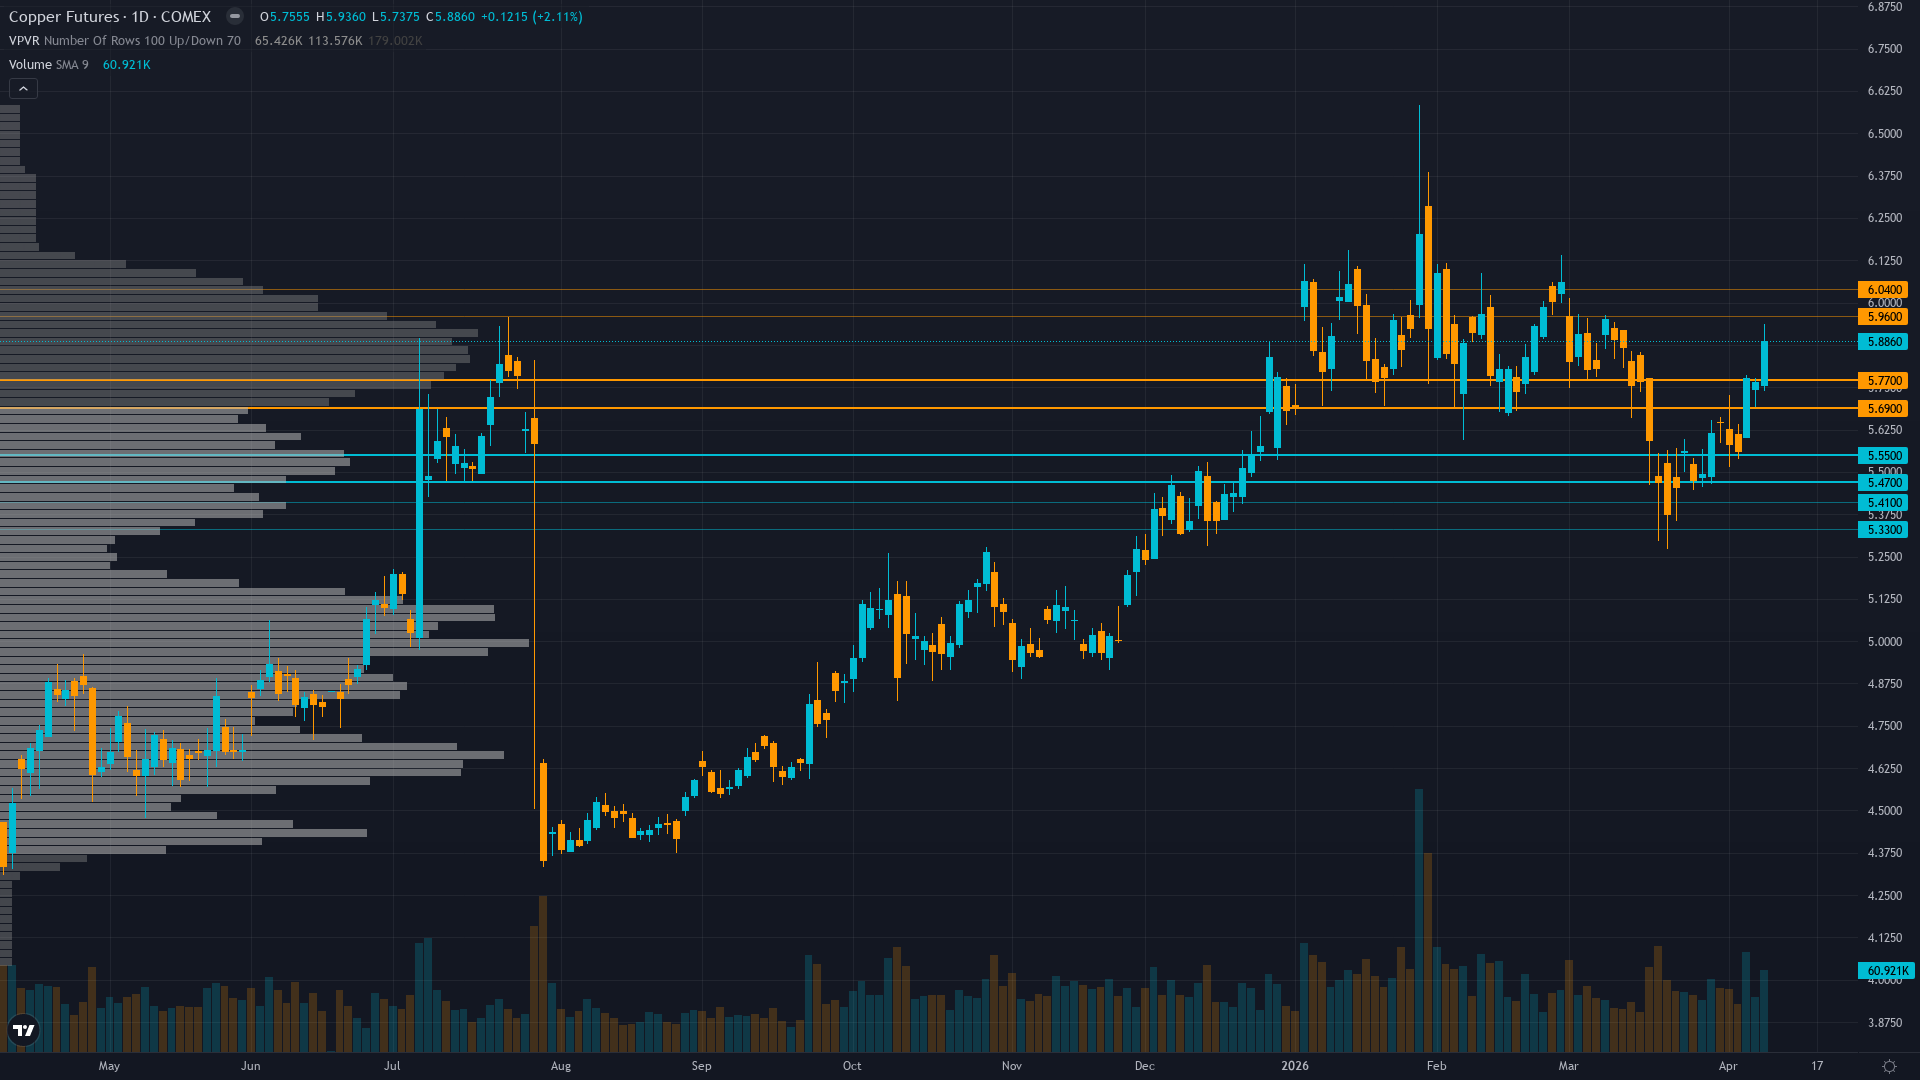
copper is trading at 5.87, up 2.13% in the last 24 hours as buyers maintain control. Price action in copper futures has compressed into a consolidation pattern, typically a precursor to a directional breakout.
Copper consolidating from January 2026 record highs with elevated prices expected to persist into 2026 supported by supply deficit fundamentals, but near-term volatility likely as market balances Grasberg supply shock against China demand mixed signals from import weakness and LME inventory eight-year highs
Forces in Play
Primary driver: Structural supply deficit from Grasberg mine disaster removing 525,000-600,000 tons through Q2 2026 remains intact while April 10 Trading Economics confirms price at $5.87/lb up 29.41% YoY validating supply scarcity premium despite consolidation from January highs
Secondary factor: China March official PMI at 50.4 (released March 31) crossed back above 50 expansion threshold from February 49.0 contraction, while April 9 Reuters report shows China copper imports slowed to 454,000 tonnes in Jan-Feb period creating mixed demand signals
Additional influence: LME inventories surged to 335,425 tonnes on March 19 (eight-year high) but available inventory excluding warrants dropped to just 89,725 tonnes, creating divergent signals between headline stockpiles and true physical market tightness
Economic backdrop: Fed on hold at 3.50-3.75% range (March 18 decision), VIX at 19.23 (April 10) below 20 threshold indicating subdued volatility environment, China PMI mixed with official 50.4 expansion vs Caixin deceleration to 50.8, DXY data stale limiting regime clarity assessment
Fundamental assessment: Acute structural supply shortage intact with Grasberg offline through Q2 2026, JPMorgan $12,500/ton Q2 target implying current $5.87/lb (~$12,900/mt) at upper range of forecasts but justified by 150,000-330,000 ton deficit projections, though China Jan-Feb import weakness creates near-term demand uncertainty
Technical Landscape
Daily uptrend holding above 50-day MA (~$5.50) and 200-day MA (~$5.20) with RSI 68-70 approaching overbought but no bearish divergence, price at $5.87 consolidating 11% below January $6.58 52-week high showing controlled digestion pattern
Trend strength registers at 6/10, suggesting meaningful but not extreme directional bias.
Risk-Reward Assessment
Primary risk: China April PMI disappointing below 50 threshold confirming Jan-Feb import weakness represents structural demand deterioration rather than temporary logistics, triggering extended profit-taking from elevated levels while LME inventory build above 335,425 tonnes validates genuine oversupply despite Grasberg disruption (Probability: medium)
Primary opportunity: April-May seasonal strength pattern (80% historical success rate) combining with China PMI confirming manufacturing resilience above 50 and Grasberg supply shock persisting through Q2 2026 driving breakout through psychological $6.00 resistance toward JPMorgan $12,500/ton ($5.68/lb equivalent) Q2 target as deficit reality forces repricing (Timeframe: 2-6 weeks as April-May spring construction season restocking materializes, China April 29 PMI validates demand floor above 50 expansion threshold, and contrarian institutional positioning at October 2023 lows creates forced chase dynamic)
This week's edge: Market may be overweighting March 19 LME inventory surge to 335,425 tonnes (eight-year high) and April 9 Reuters China Jan-Feb import weakness to 454,000 tonnes as demand destruction signals while underweighting that available LME inventory excluding warrants dropped to just 89,725 tonnes revealing true physical tightness, April-May seasonal pattern shows 80% historical success rate into spring construction restocking, China official PMI at 50.4 confirms expansion resumption validating demand floor despite import logistics noise, and contrarian institutional positioning at October 2023 lows creates asymmetric upside setup toward $6.00 psychological resistance as next catalyst April 29 China PMI potentially triggers breakout
Risk Environment
With vol at the 65th percentile over 90 days, copper price is in a measured regime that doesn't require unusual adjustments. Volatility is stable, with realised vol holding steady across timeframes. This equilibrium can persist but eventually resolves into expansion or contraction.
Current 28.5% short-term volatility (5-day) suggests daily ranges of 2-3% versus normal 1.5-2%, record high consolidation showing controlled price action rather than blow-off top characteristics with tightening ranges since March indicating digestion phase nearing completion ahead of April 29 catalyst event, supply-driven rallies historically more sustainable than monetary-driven moves creating confidence in trend continuation
Seasonal Context
Historically, April 2026 has favoured the upside for COMEX copper (65% win rate). Peak demand season for industrial metals.
Week Ahead Outlook
The next major catalyst is China April PMI release (critical demand indicator for 50% of global copper consumption) on Wednesday 29 April — a high-impact event that could materially shift the directional picture.
For copper, the balance between existing momentum and scheduled risk events sets the stage for the week ahead.
This analysis covers one dimension. Our full weekly report combines six specialist agents into a single actionable briefing with directional bias, key levels, and risk-opportunity matrix.
Start Free — Get the Market of the WeekFree weekly report · No credit card · Upgrade anytime


