Copper Forecast This Week — Outlook, Drivers & Key Levels
This week's Copper outlook: key drivers, volatility context, risk-opportunity assessment and the week ahead.

Current Market Picture
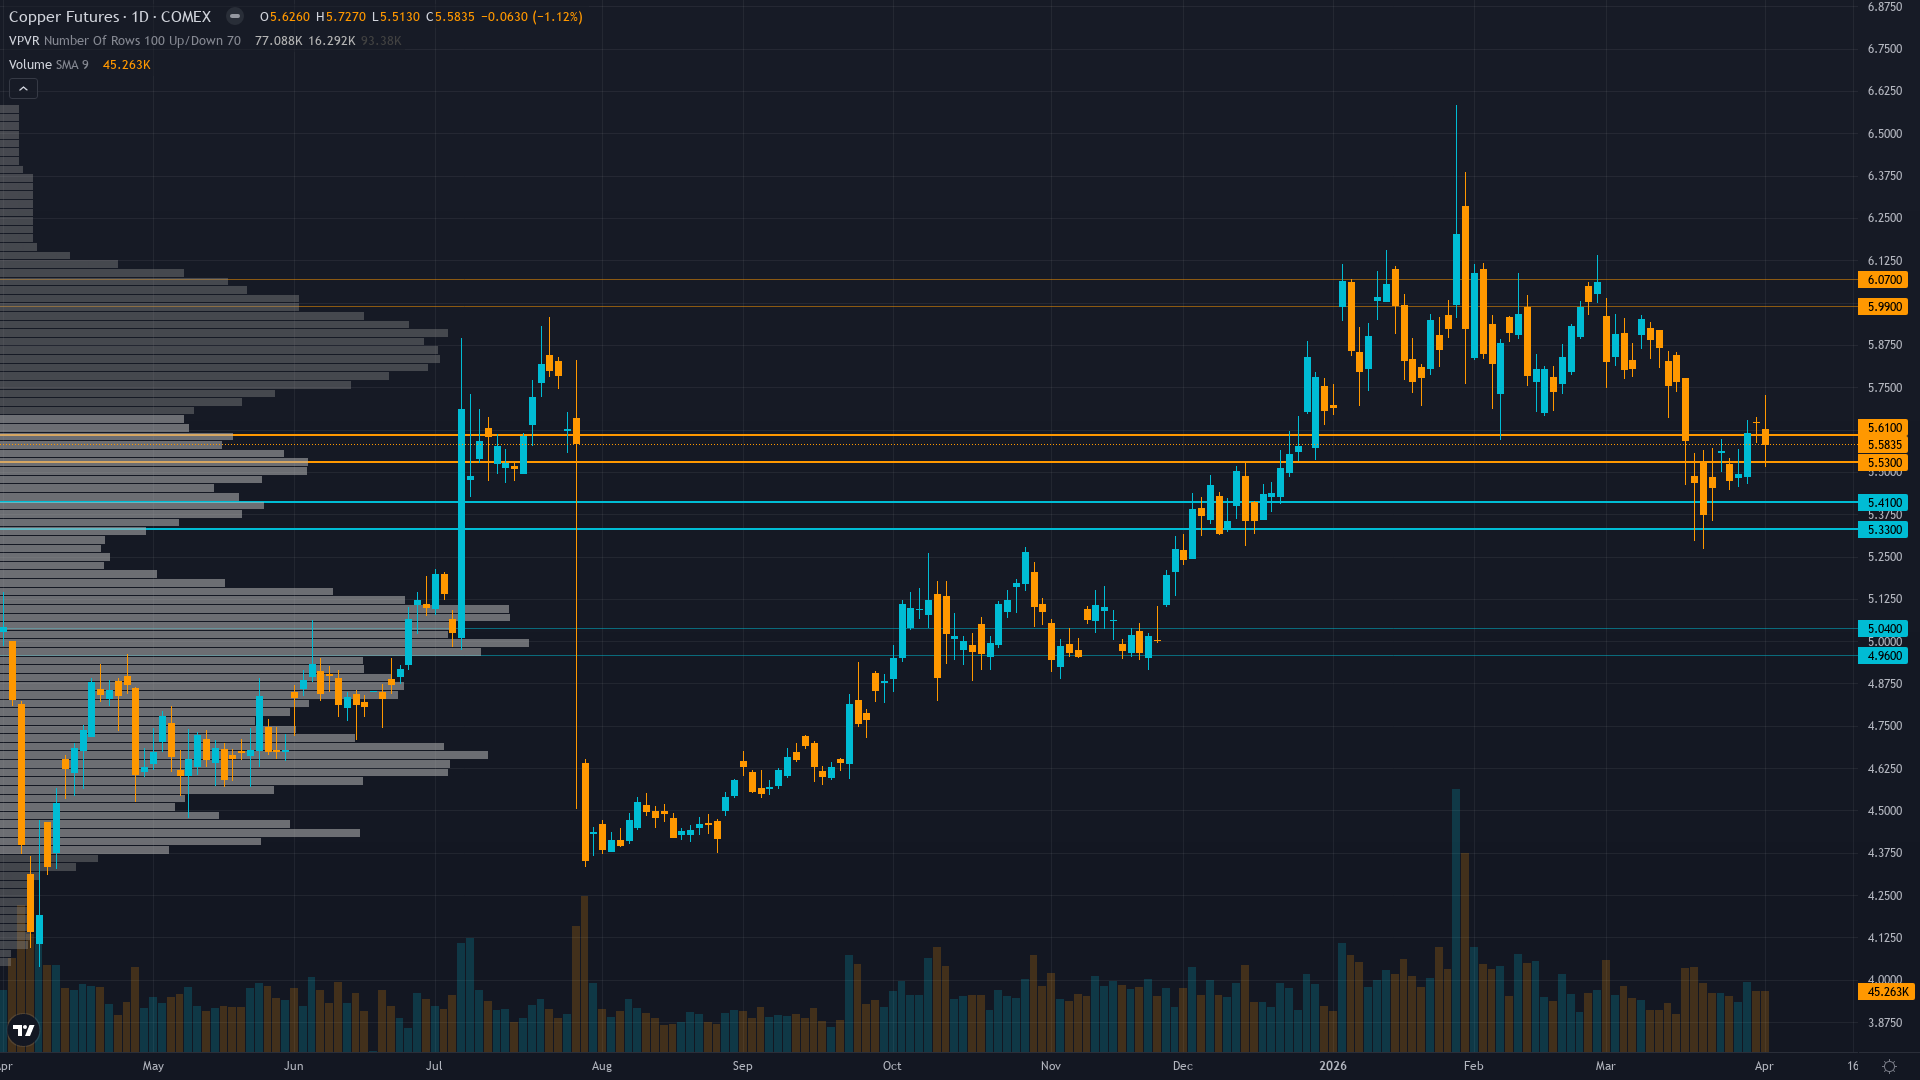
copper is trading at 5.68, up a modest 0.62% as the market edges higher. The market in copper futures is coiling, with narrowing price ranges suggesting stored energy that will eventually release.
Copper consolidating from January 2026 record highs with elevated prices expected to persist but near-term volatility likely as market balances supply deficit fundamentals against USD strength, China demand mixed signals, and geopolitical risk premium fluctuations
Key Drivers This Week
Primary driver: BNN Bloomberg April 2 confirms easing geopolitical tensions (Iran/Strait of Hormuz) providing near-term support while structural supply deficit from Grasberg mine closure through Q2 2026 removing 525k-600k tons remains intact, creating favorable supply-demand imbalance
Secondary factor: China NBS Manufacturing PMI rose to 50.4 in March (released March 31, modest beat vs 50.1 consensus) signaling expansion resumption after February 49.0 contraction, validating demand floor despite Caixin PMI deceleration to 50.8
Additional influence: Price recovering to $5.68 after March low of $5.37 represents +5.8% bounce validating Bloomberg March 23 inventory drawdown signal that showed biggest weekly drop of year in Chinese copper stocks, confirming physical demand resilience
Economic backdrop: Fed on hold at 3.75% with no rate cut until December 2026 minimum, DXY at 100.50 (10-month high) creating USD headwind, VIX sub-20 levels (April 2 data) consistent with risk-on conditions offsetting China PMI mixed signals
Fundamental assessment: Structural deficit materializing now with J.P. Morgan forecasting 330,000-ton 2026 deficit, LME inventories critically low at 347,475 tons (March 23), Grasberg offline through Q2 2026, valuation fair-to-slightly-undervalued at current levels vs $12,500/ton Q2 target
Price Structure
Daily uptrend above 50-day MA (~$5.40-5.45) and 200-day MA (~$5.10-5.20), price at $5.68 consolidating 13% below January $6.58 52-week high, RSI 60-68 positive momentum without overbought extremes
Trend strength sits at 6/10, reflecting a market that has directional bias but hasn't reached extreme conviction.
Upside & Downside
Primary risk: Sustained USD strength above 100 DXY through Q2 2026 driven by geopolitical safe-haven bid (Iran/Hormuz conflict resolution uncertainty) mechanically pressuring copper prices regardless of underlying demand fundamentals, or China property recovery failing to materialize despite Q1 stabilization signals (Probability: medium)
Primary opportunity: April-May seasonal strength pattern (historically copper peaks in April/May after December lows per Stock Trader's Almanac) combining with China PMI expansion confirmation, Grasberg supply shock persistence, and contrarian institutional positioning creating asymmetric upside toward $6.00-6.15 prior resistance (Timeframe: 2-6 weeks as April-May seasonal tailwinds materialize, mid-April China Q1 GDP validates manufacturing resilience (expected April 16-18), and geopolitical risk premium fades following Iran tensions easing)
This week's edge: Market may be overweighting USD strength at 10-month high and mixed China PMI signals (Caixin deceleration offsetting NBS expansion) while underweighting that April 2 BNN Bloomberg confirms geopolitical tensions easing removing risk premium headwind, April-May seasonal pattern historically shows copper peaks during this window driven by construction restocking (80% success rate per historical data), and Bloomberg March 23 inventory drawdown validates demand recovery from Q4 2025 weakness creating asymmetric upside setup toward $6.00 resistance
Volatility Context
At the 65th percentile, copper price volatility sits in a normal range, neither compressed enough to signal a breakout nor elevated enough to demand caution. Realised vol is holding its current level, suggesting the market has found a temporary equilibrium in its risk pricing.
Current volatility suggests daily ranges of 2-3% versus normal 1.5-2%, record high consolidation showing controlled price action rather than blow-off top characteristics with tightening ranges indicating digestion phase nearing completion ahead of mid-April China catalyst event, supply-driven rallies historically more sustainable than monetary-driven moves
Seasonal Patterns
The seasonal tailwind for COMEX copper in April 2026 is well-documented at 65%. Peak demand season for industrial metals.
Looking Forward
All eyes turn to China Q1 GDP and March industrial production data release on Thursday 16 April, which carries enough weight to force a decisive directional move.
The week ahead for copper price hinges on whether the prevailing consolidating regime can absorb the scheduled catalysts without a regime shift.
This analysis covers one dimension. Our full weekly report combines six specialist agents into a single actionable briefing with directional bias, key levels, and risk-opportunity matrix.
Start Free — Get the Market of the WeekFree weekly report · No credit card · Upgrade anytime


