Copper Forecast This Week — Outlook, Drivers & Key Levels
This week's Copper outlook: key drivers, volatility context, risk-opportunity assessment and the week ahead.

Where Things Stand
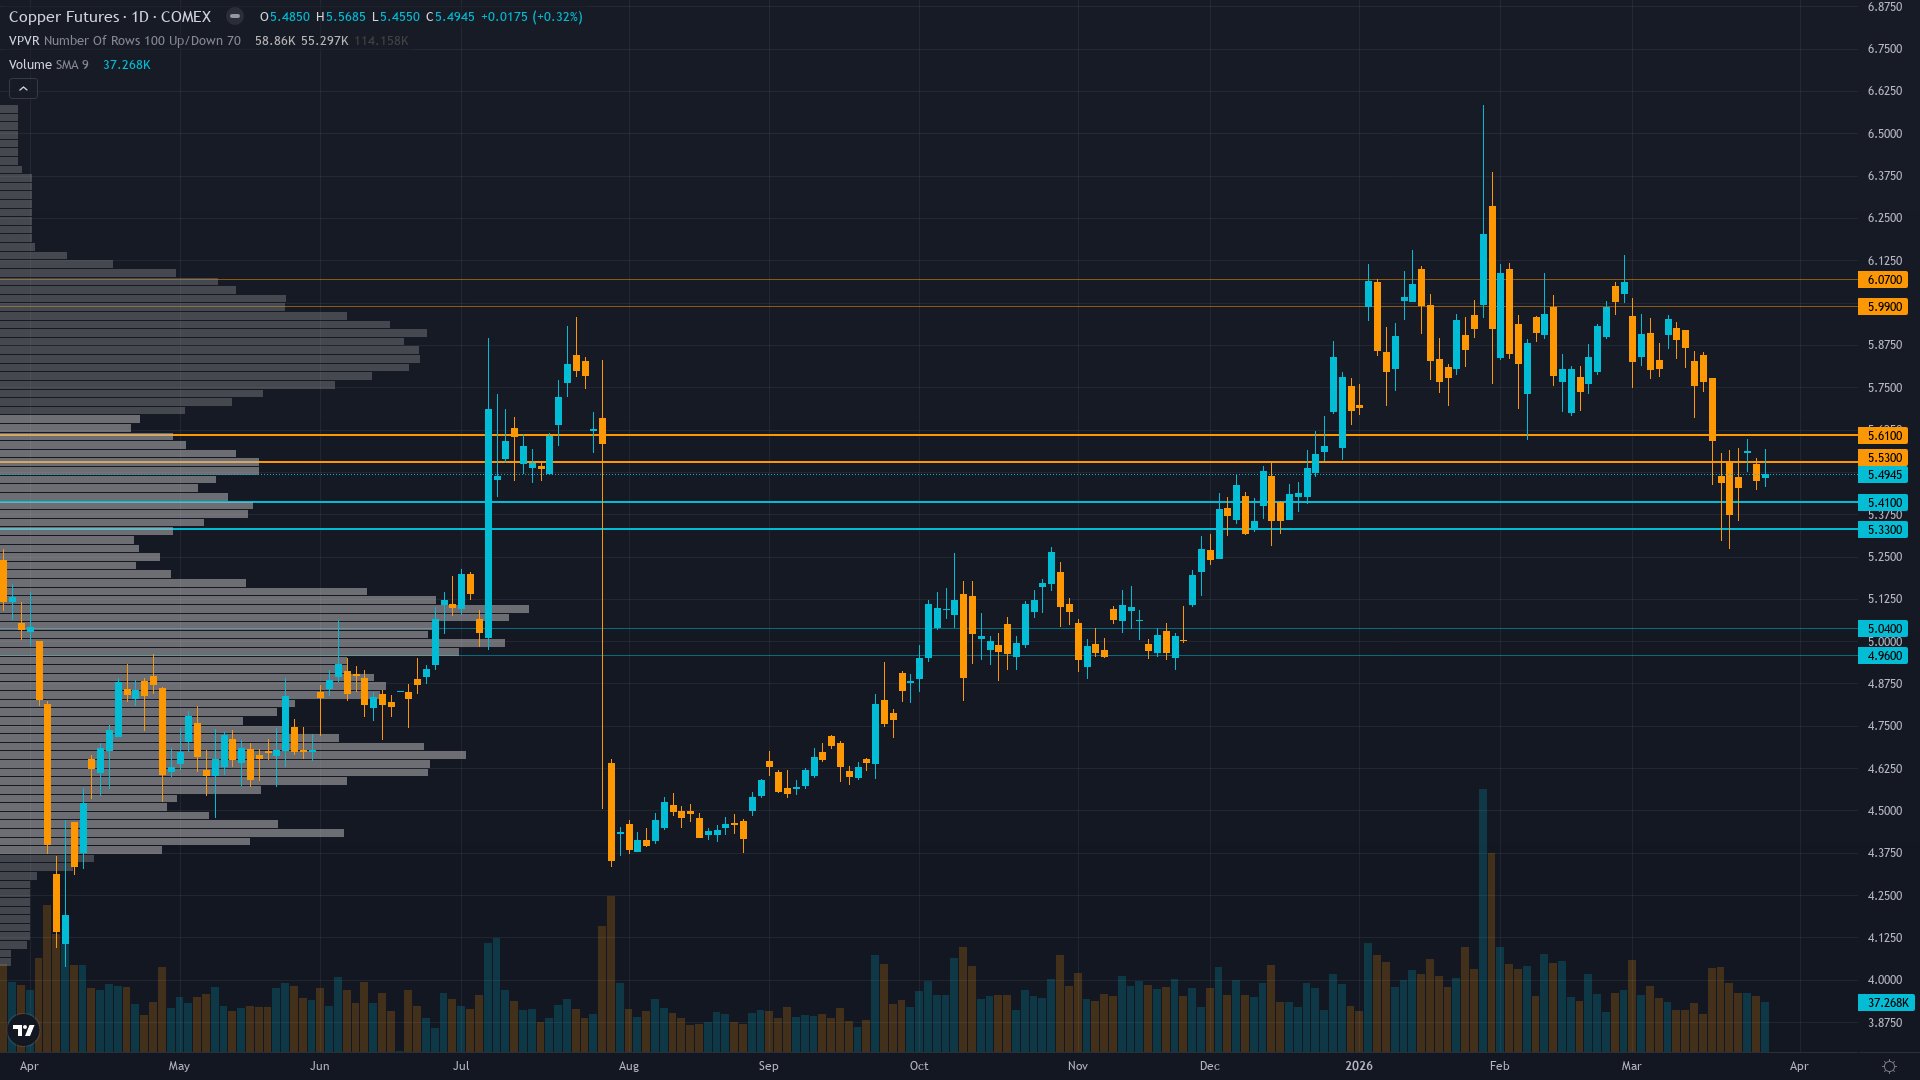
copper sits at 5.49 after a 0.32% gain — a quiet move higher without aggressive momentum. copper futures is consolidating, with price compressing into a narrower range as the market builds energy for its next move.
Copper consolidating from record highs with elevated prices expected into 2026 but near-term uncertainty from China demand trajectory, elevated inventories, and risk-off VIX environment creating volatility
What's Driving Price
Primary driver: Bloomberg March 23 confirmed Chinese copper inventories experienced biggest weekly drop of the year (78,700 tons to 486,200 tons) as falling prices stimulated physical demand—validating demand recovery from Q4 2025 weakness
Secondary factor: Structural supply deficit intact with Grasberg mine offline through Q2 2026 removing 525,000-600,000 tons, JPMorgan forecasts $12,500/ton Q2 2026 target and 330,000-ton annual deficit creating supply floor
Additional influence: VIX at 31.05 (elevated fear zone) creating macro headwind but copper resilience at $5.49 holding 2.2% above last week's $5.37 low signals market absorbing risk-off pressure
Economic backdrop: China Manufacturing PMI at 52.1 (5-year high strongest since 2020) and US PMI 52.4 both beat expectations confirming manufacturing expansion, Fed on hold at 3.5-3.75%, VIX 31.05 risk-off creating temporary headwind
Fundamental assessment: Material positive shift: Bloomberg March 23 inventory drawdown validates demand recovery thesis after March 18-19 inventory surge created false supply overhang—deficit reality reasserting as China physical buying returns
Chart Assessment
Daily corrective phase below $5.97 resistance but holding above $5.37 support, RSI at 35.11 neutral-oversold, price remains above major 200-day MA providing structural bull market context
With trend strength at 5/10, the directional signal is present but far from decisive.
Risk & Opportunity
Primary risk: VIX remaining elevated above 25 triggering continued risk-off liquidation despite improving China physical demand, or March official PMI disappointing below 52.1 Caixin reading invalidating recovery narrative (Probability: medium)
Primary opportunity: March-April seasonal strength (80% historical success rate) combining with China inventory drawdown validation and contrarian institutional positioning at Oct 2023 lows creating asymmetric upside toward $5.75-6.00 (Timeframe: 2-6 weeks as March seasonal tailwinds materialize, April China data confirms Q1 manufacturing resilience, and VIX normalization below 25 removes macro headwind)
This week's edge: Market overweighting March 18-19 LME inventory surge to 335,425t (highest since 2019) as demand destruction signal while underweighting Bloomberg March 23 confirmation that Chinese inventories posted biggest weekly drop of year (78,700t decline to 486,200t) as falling prices stimulated physical demand—inventory build was temporary positioning not structural weakness, validating demand floor hypothesis with China PMI at 52.1 5-year high, March-April 80% seasonal success rate, and contrarian institutional positioning at Oct 2023 lows creating asymmetric upside setup
Volatility Backdrop
copper price is in a high-volatility environment (72th percentile over 90 days), where position sizing discipline becomes critical. Volatility expansion is underway, suggesting the market is moving into a phase of heightened activity and wider ranges.
Current 35.2% short-term volatility suggests daily ranges of 3-4% versus normal 1.5-2%, Bloomberg March 23 catalyst combined with contrarian positioning at Oct 2023 lows creates potential for volatility compression rally if China data validates demand recovery into month-end
Historical Seasonal Bias
Seasonal analysis shows a historically bullish bias for COMEX copper in March 2026, with a 62% win rate. Spring construction and manufacturing ramp-up.
What to Watch
The China March official PMI release and US ISM Manufacturing data on Wednesday 1 April stands as the week's primary risk event — high-impact and capable of overriding the existing technical and sentiment setup.
The interplay between consolidating market conditions and upcoming catalysts will define this week's trading landscape for HG futures.
This analysis covers one dimension. Our full weekly report combines six specialist agents into a single actionable briefing with directional bias, key levels, and risk-opportunity matrix.
Start Free — Get the Market of the WeekFree weekly report · No credit card · Upgrade anytime


