Copper Forecast This Week — Outlook, Drivers & Key Levels
This week's Copper outlook: key drivers, volatility context, risk-opportunity assessment and the week ahead.

Current Market Picture
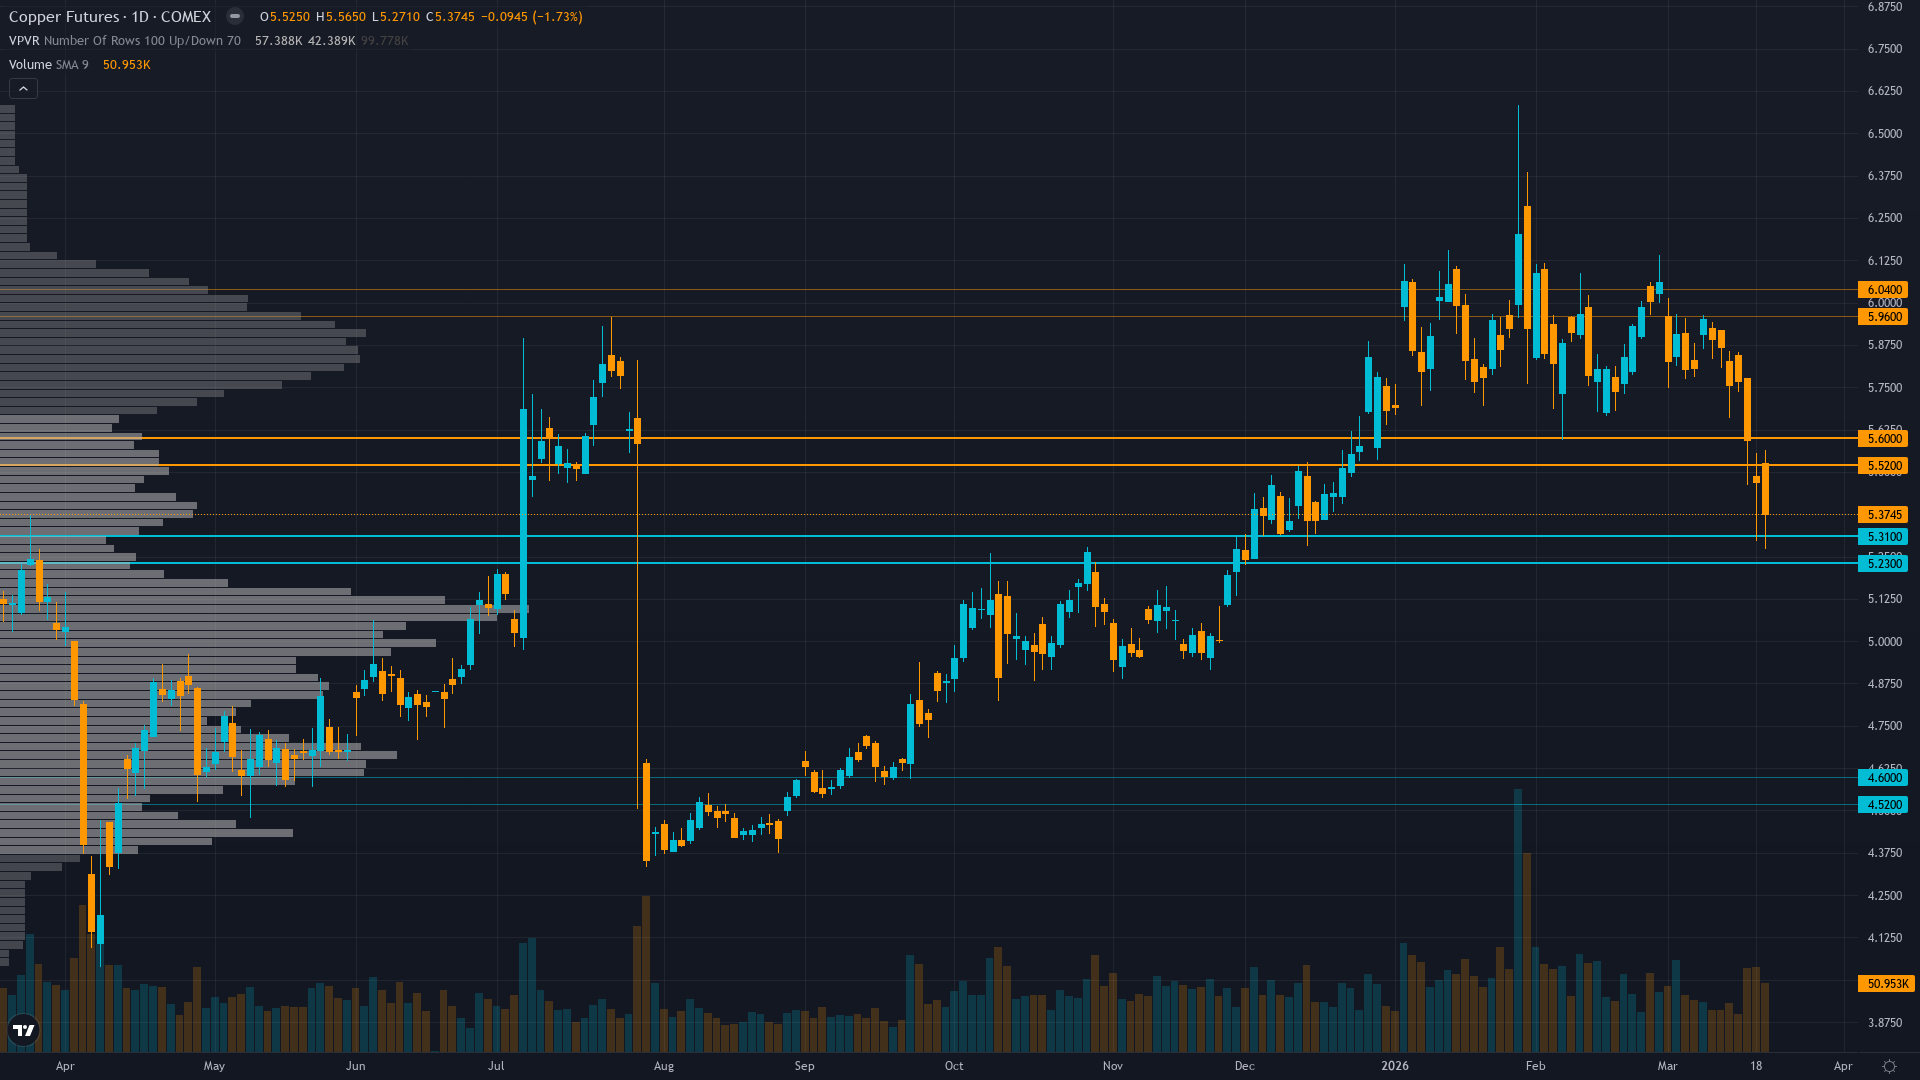
copper is trading at 5.3745, down 1.73% as selling pressure weighs on price. copper futures is in a breaking down market state, requiring careful assessment of current conditions.
Copper elevated on supply deficit narrative but near-term consolidation expected with elevated inventories, China demand uncertainty, and risk-off sentiment creating volatility
Key Drivers This Week
Primary driver: LME inventories surged to 335,425 tonnes on March 19 (highest since Sept 2019) signaling rapid supply/demand loosening despite Grasberg disruption through Q2 2026
Secondary factor: Copper down 18.5% from January highs ($6.58 to $5.37) with price breaking decisively below $5.50 and 50-day MA as technical structure deteriorates into active correction
Additional influence: VIX at 26.78 (above 25 fear threshold) creating RISK-OFF macro regime headwind pressuring cyclical commodities despite China PMI at 52.1 5-year high
Economic backdrop: Fed held rates at 3.5-3.75% (March 18, 2nd consecutive hold) with China Caixin Manufacturing PMI surging to 52.1 (5-year high Feb release) but VIX at 26.78 creating risk-off pressure overriding positive data
Fundamental assessment: Supply/demand balance rapidly deteriorating near-term with LME stocks +18,775t (Mar 18) reaching 335,425t despite structural Grasberg deficit—cancelled warrants fell to 13.06% indicating metal entering warehouses faster than physical buyers removing
Price Structure
Clear downtrend below $5.50 and 50-day MA with RSI at 45-50 neutral zone, price trading at $5.37 near session lows confirming breakdown from consolidation that held since mid-March
Trend strength registers just 3/10, which typically corresponds to choppy, directionless price action.
Upside & Downside
Primary risk: Continued inventory builds if March 19's 335,425t LME level rises further while cancelled warrants remain below 15% confirming genuine demand weakness from China rather than temporary logistical factors (Probability: medium)
Primary opportunity: Contrarian positioning extreme at 32,788 managed money net long (Oct 2023 lows) creating asymmetric squeeze potential if China PMI momentum sustains into April data or Grasberg timeline extends beyond Q2 2026 (Timeframe: 2-6 weeks as March 31 China PMI validates manufacturing resilience and month-end/Q1-end rebalancing flows trigger forced short covering from depressed positioning levels)
This week's edge: Market may be underweighting that March 18-19 LME inventory surge to 335,425t (highest since 2019) with falling cancelled warrants represents genuine demand weakness not temporary logistics, creating near-term bearish catalyst despite Grasberg remaining offline—contrarian institutional positioning at Oct 2023 lows noted but three disciplines signal bearish with conviction
Volatility Context
At the 72th percentile of its 90-day range, copper price volatility is running hot, creating both opportunity and risk for directional traders. Realised vol is trending higher across the curve, which tends to accompany transitional periods where the market is repricing risk.
Current 35.2% short-term volatility suggests daily ranges of 3-4% versus normal 1.5-2%, breakdown from 10-week consolidation showing acceleration not exhaustion with declining open interest indicating position liquidation, fresh catalyst (inventory data) plus technical break creates high-probability continuation setup near-term
Seasonal Patterns
The seasonal tailwind for COMEX copper in March 2026 is well-documented at 62%. Spring construction and manufacturing ramp-up.
Looking Forward
All eyes turn to China official PMI release and month-end rebalancing flows on Tuesday 31 March, which carries enough weight to force a decisive directional move.
The week ahead for copper price hinges on whether the prevailing breaking down regime can absorb the scheduled catalysts without a regime shift.
This analysis covers one dimension. Our full weekly report combines six specialist agents into a single actionable briefing with directional bias, key levels, and risk-opportunity matrix.
Start Free — Get the Market of the WeekFree weekly report · No credit card · Upgrade anytime


