Copper COT & Institutional Positioning — Smart Money Analysis
Copper institutional positioning: COT data, sentiment analysis and smart money flow assessment.

Where Institutions Stand
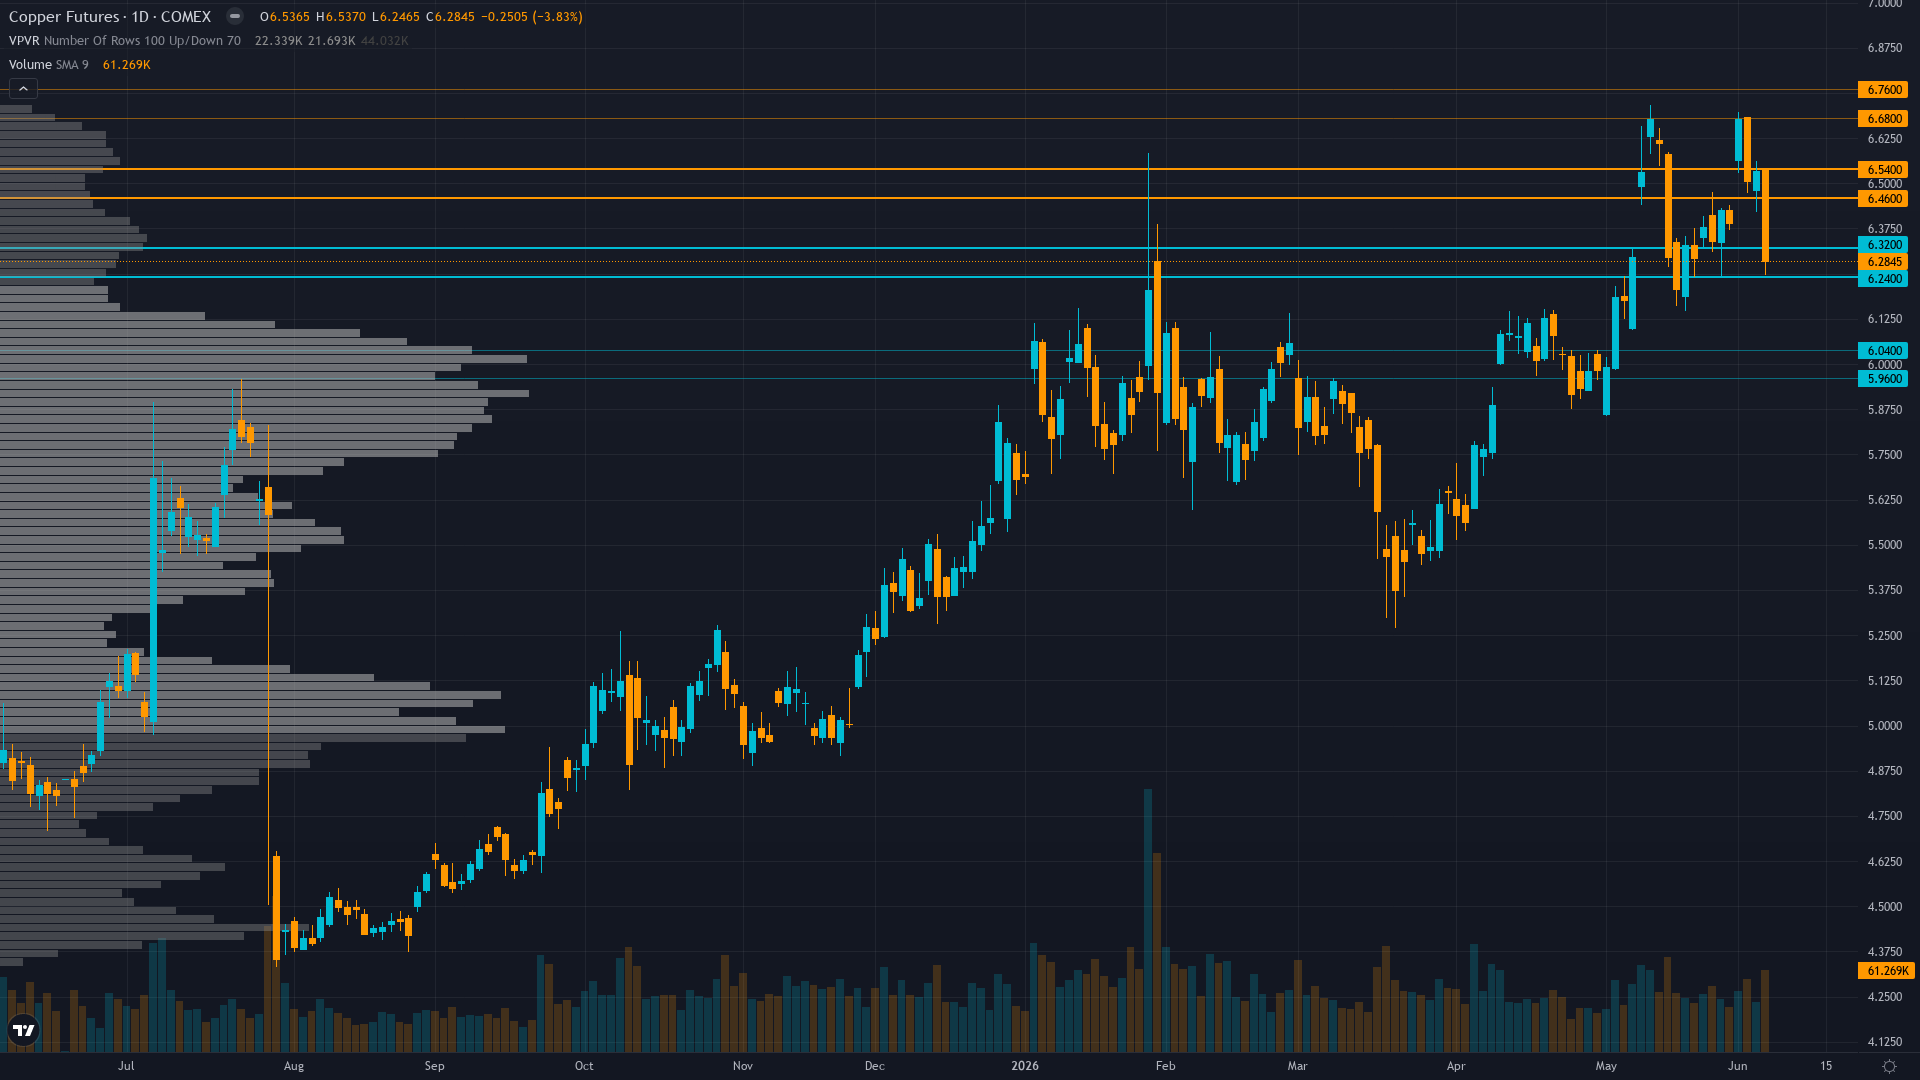
copper is trading at 6.28, down 3.97% as selling pressure weighs on price.
Managed money net long at 73.0K contracts as of May 29 down modestly from 75.9K prior week and 20-week high of 76.3K on May 15, positioning at upper-mid historical range showing controlled profit-taking rather than forced liquidation, China state reserve buying provides structural bid but insufficient to prevent June 6-7 breakdown
Consensus vs MAD View
Market consensus: Copper consolidating from January 2026 record highs with elevated prices expected but near-term breakdown from $6.54 to $6.28 creating technical damage and uncertainty as market balances structural supply deficit against demand mixed signals, Section 232 tariff policy uncertainty, and elevated positioning at 5-month highs creating tactical vulnerability
Primary driver: Technical breakdown on June 6-7 from $6.54 to $6.28 (-3.83%) breaking critical $6.30 support level on elevated volume, overriding structural supply deficit fundamentals as failed breakout pattern triggers distribution phase
Where the Crowd May Be Wrong
Desk's BEARISH stance with conviction at minimum threshold reflects same analytical paralysis as market consensus experiencing from June 6-7 breakdown creating fundamental-technical schism, creating low divergence from prevailing uncertainty narrative with no contrarian edge identified as both desk and market await June 30 tariff and month-end China PMI resolution
Crowd Psychology
Neither side has committed heavily to copper futures, leaving sentiment in a neutral zone that offers little directional guidance on its own.
Options Flow
Insufficient current options data available with IV last reported at 33.59% moderately elevated, lack of directional skew clarity limits options confirmation though elevated IV suggests defensive positioning reflecting ongoing supply/demand narrative uncertainty
The Bottom Line on Positioning
The positioning mosaic for HG futures combines fear sentiment with expanding volatility conditions. Trend strength is low at 3/10, indicating weak directional conviction and potential for range-bound behaviour. Taken together, institutional behaviour, crowd psychology, and derivatives data frame the setup heading into the new week.
This analysis covers one dimension. Our full weekly report combines six specialist agents into a single actionable briefing with directional bias, key levels, and risk-opportunity matrix.
Start Free — Get the Market of the WeekFree weekly report · No credit card · Upgrade anytime