AUD/USD Key Levels This Week — Support, Resistance & Confluence Zones
AUD/USD key levels breakdown: support zones, resistance zones, confluence and price structure.

Structural Assessment
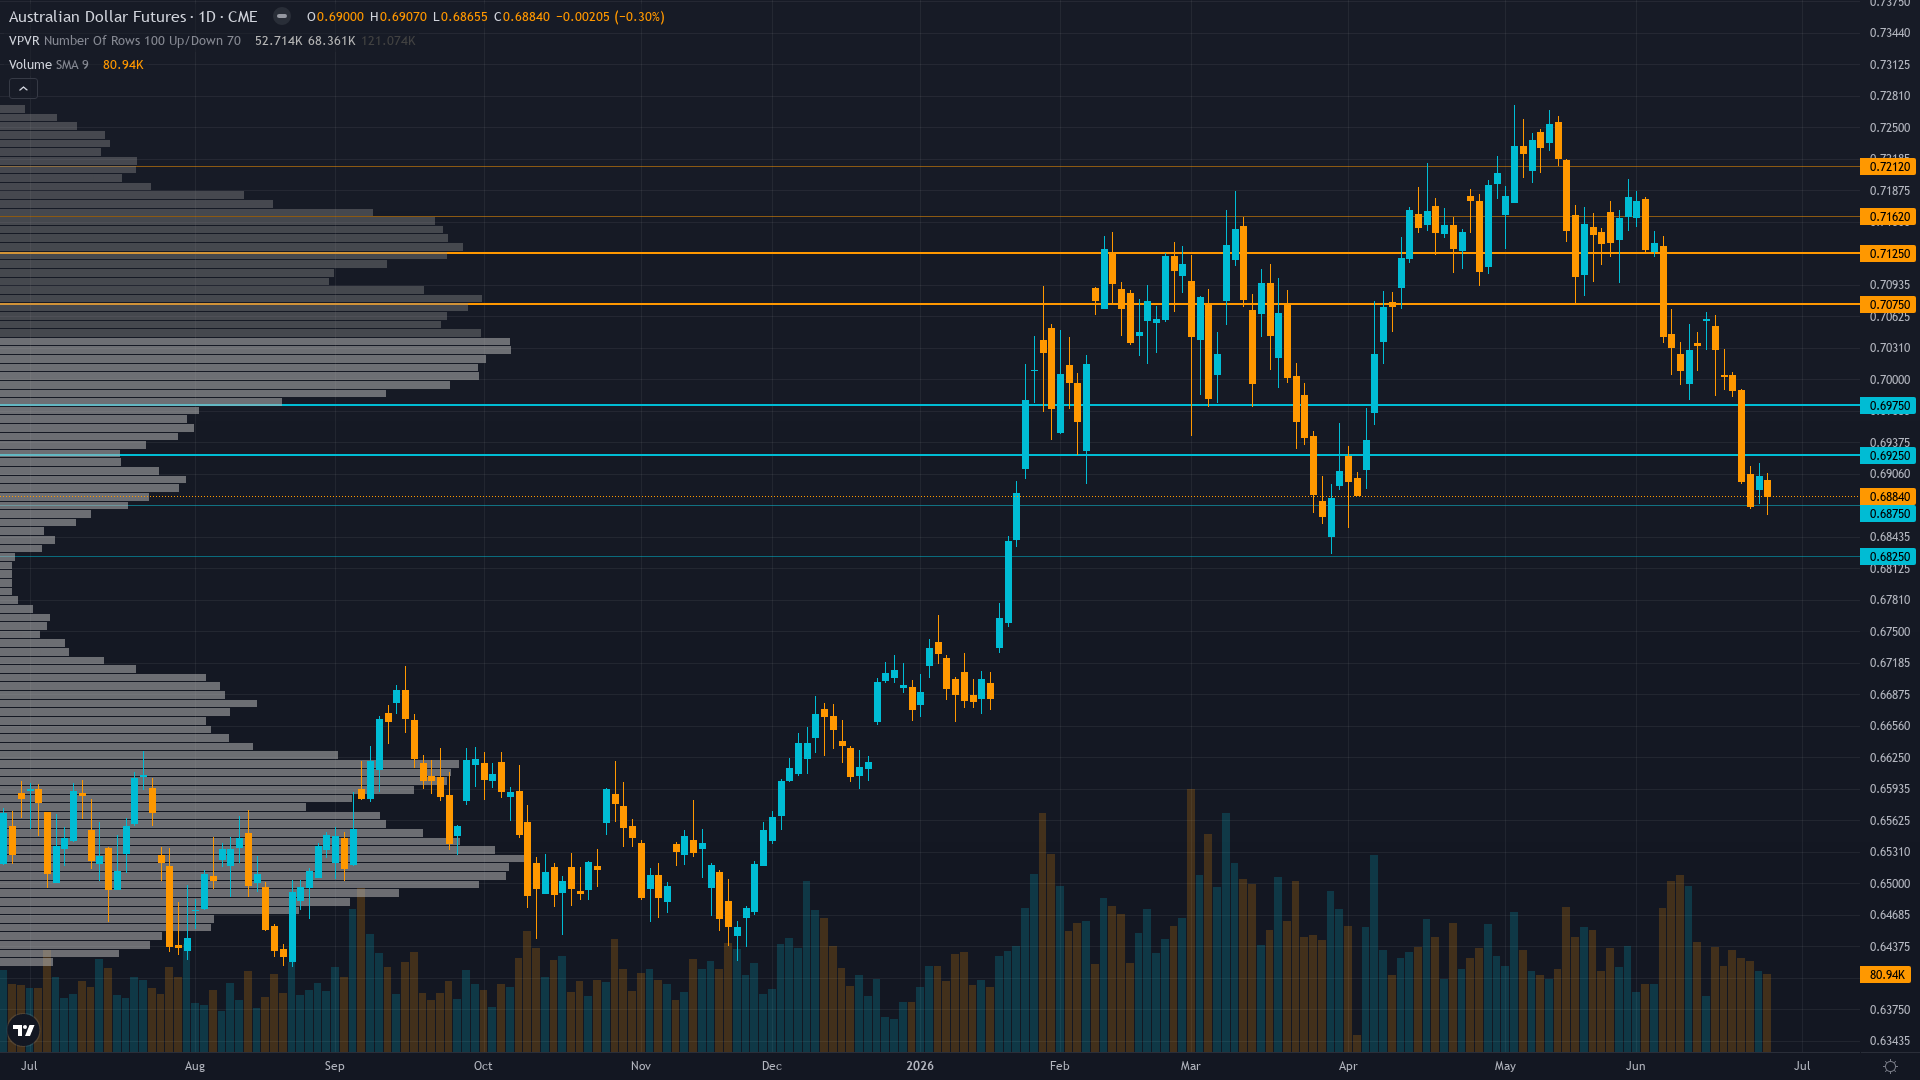
AUD/USD sits at 0.6889 after slipping 0.31% — a shallow pullback rather than a decisive move. aussie dollar is in a consolidating after breakdown market state, requiring careful assessment of current conditions.
Trading at 0.6889 below 50-day MA at 0.7164 with RSI 23.59 deeply oversold but no bullish divergence, downtrend intact but losing momentum in consolidation range
At 4/10, trend strength is middling — enough to suggest a lean, but not enough to trade with high confidence.
Support Architecture
Support levels for AUD/USD are defined by zones of prior institutional demand. The depth and frequency of prior tests at these levels determines their likely strength.
The strength of support depends on the current ranging after breakdown with no fresh directional catalyst regime and volume profile at each level.
Upside Barriers
Resistance levels above 6A futures current price represent zones of historical supply. The significance of each level scales with the number of prior tests and the volume traded there.
The current consolidating after breakdown regime influences how aggressively these resistance zones are likely to be tested and whether they hold or fold.
Confluence & Methodology
Confluence is the differentiator between a line on a chart and a level worth trading. For aussie dollar, the zones with the highest conviction are those validated across technical, institutional, and derivatives dimensions simultaneously.
Normalizing volatility at 52nd percentile suggests 60-70bp daily ranges versus March 100-150bp creating stable environment; breakout above 0.695 or breakdown below 0.68 requires sustained follow-through providing clearer conviction signals post-China PMI resolution
Beyond Lines on a Chart
Our approach to key levels is designed to filter noise from signal. Six independent agents each assess the same price zones from different perspectives. A level confirmed by one discipline is interesting. A level confirmed by four or five is worth building a trade plan around.
This multi-discipline approach means the levels in our paid reports carry institutional-grade confluence — not just lines on a chart, but zones validated across every analytical dimension that matters.
Our paid reports include specific support and resistance levels identified by six specialist agents — technical structure, institutional positioning, options flow, fundamentals, sentiment, and economic analysis. Not just lines on a chart, but zones validated by multi-discipline confluence.
Start Free — Get the Market of the WeekFree weekly report · No credit card · Upgrade anytime