AUD/USD Key Levels This Week — Support, Resistance & Confluence Zones
AUD/USD key levels breakdown: support zones, resistance zones, confluence and price structure.

Price Architecture
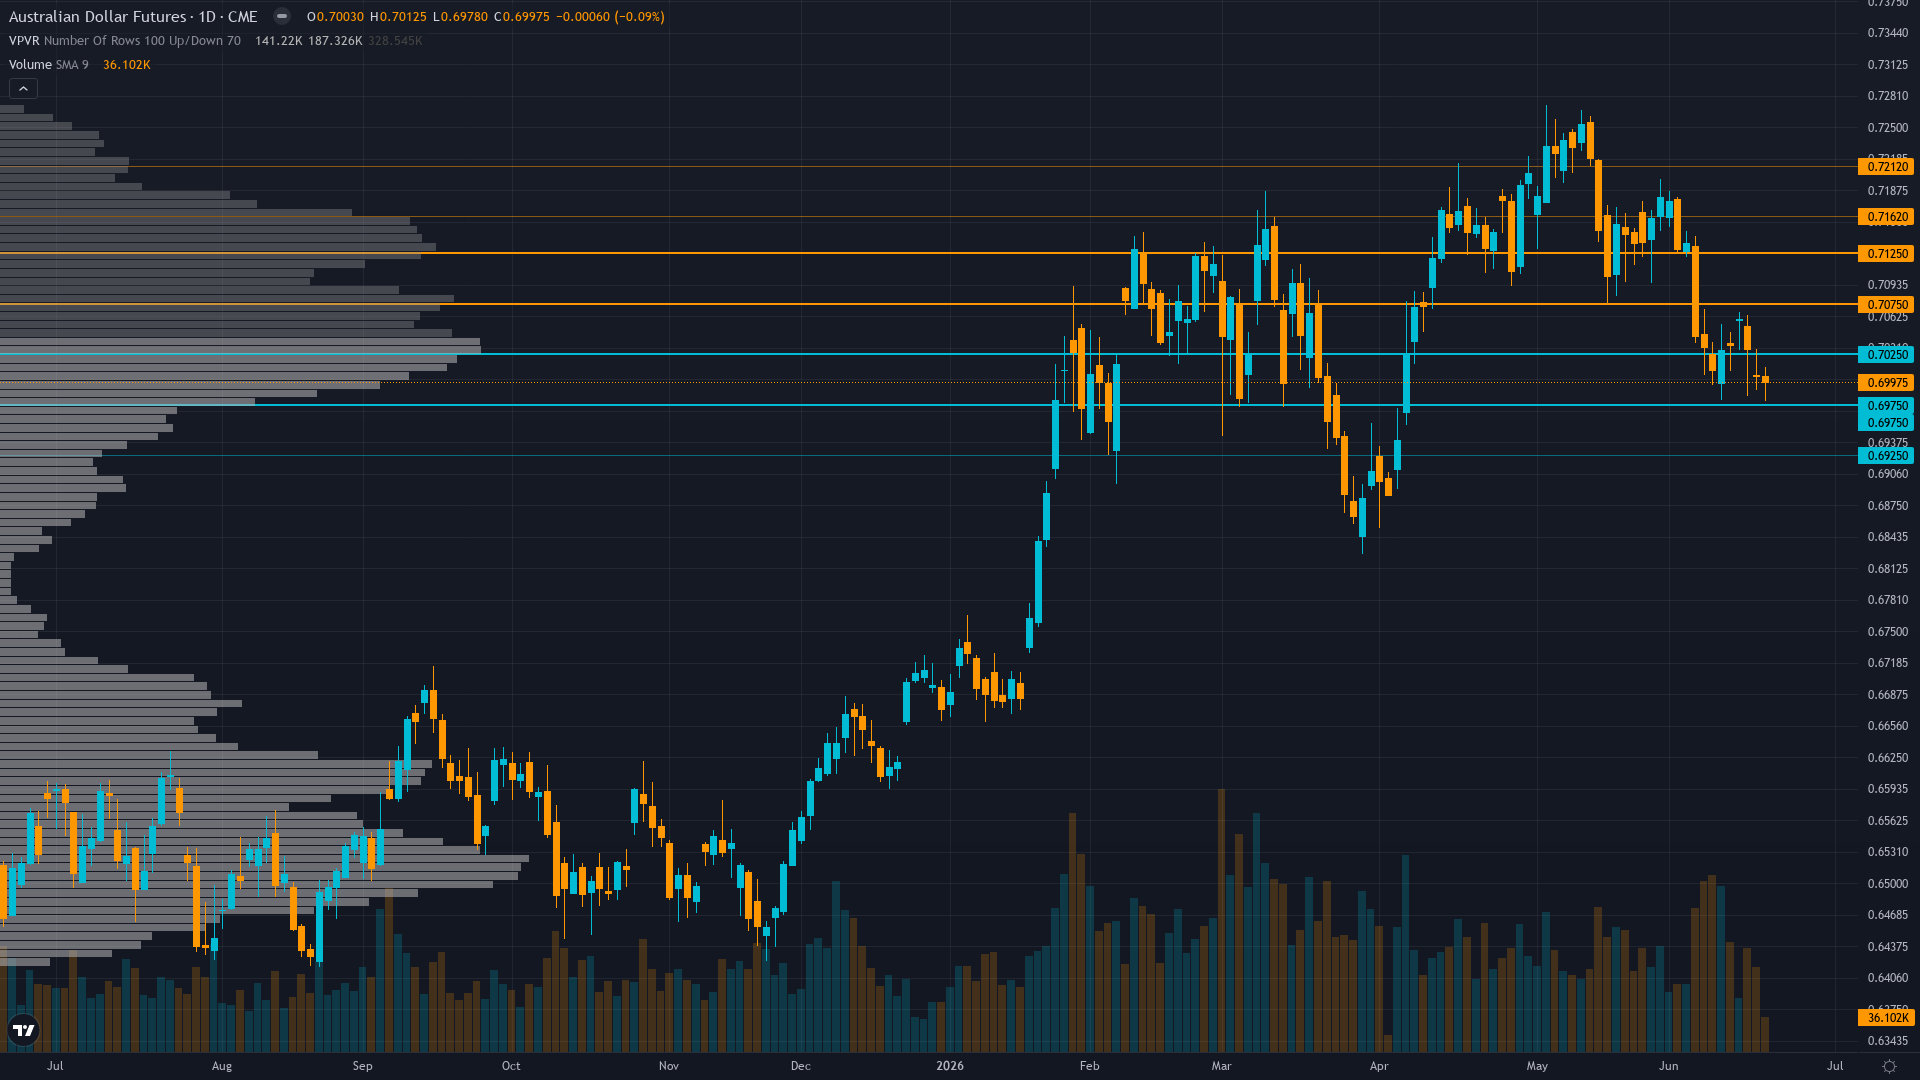
AUD/USD sits at 0.7 after slipping 0.35% — a shallow pullback rather than a decisive move. aussie dollar is in a breaking down market state, requiring careful assessment of current conditions.
Breaking down from 0.7041 toward 0.70 psychological support with RSI 36.2 oversold but no bullish divergence, trading below 50-day MA confirming bearish momentum structure
Trend strength sits at 4/10, reflecting moderate directional pressure without clear dominance.
Downside Protection
The downside architecture for aussie futures features support zones rooted in prior buying activity. These are not arbitrary lines but areas where real capital has previously been committed.
The reliability of support under breaking down under dual central bank catalyst resolution bearish for AUD conditions is shaped by the interplay between volatility regime and historical volume at each level.
Resistance Zone Context
The upside path for AUDUSD is marked by resistance zones where prior selling activity created structural barriers. Clearing these zones requires either strong momentum or a shift in the fundamental picture.
In the current market state, resistance zones remain key decision points.
Analytical Convergence
The most actionable levels for AUD/USD are those where multiple analytical disciplines converge. When technical structure, institutional positioning, and options flow all point to the same zone, the probability of price reacting there increases meaningfully.
Normalizing volatility at 52nd percentile suggests 60-70bp daily ranges versus March 100-150bp creating stable directional environment; breakdown below 0.695 requires sustained follow-through providing clearer conviction signals
Our Multi-Agent Approach to Key Levels
The levels in our paid reports are generated by six specialist agents working in parallel. Technical analysis provides the structural framework, institutional data shows where capital is committed, options flow reveals hedging behaviour, fundamentals anchor levels to value, sentiment gauges crowd positioning, and economic analysis times the catalysts.
The output is a curated set of levels with institutional-grade validation — the kind of multi-dimensional analysis that hedge fund research desks produce, delivered at a fraction of the cost.
Our paid reports include specific support and resistance levels identified by six specialist agents — technical structure, institutional positioning, options flow, fundamentals, sentiment, and economic analysis. Not just lines on a chart, but zones validated by multi-discipline confluence.
Start Free — Get the Market of the WeekFree weekly report · No credit card · Upgrade anytime


