30-Year Treasury Key Levels This Week — Support, Resistance & Confluence Zones
30-Year Treasury key levels breakdown: support zones, resistance zones, confluence and price structure.

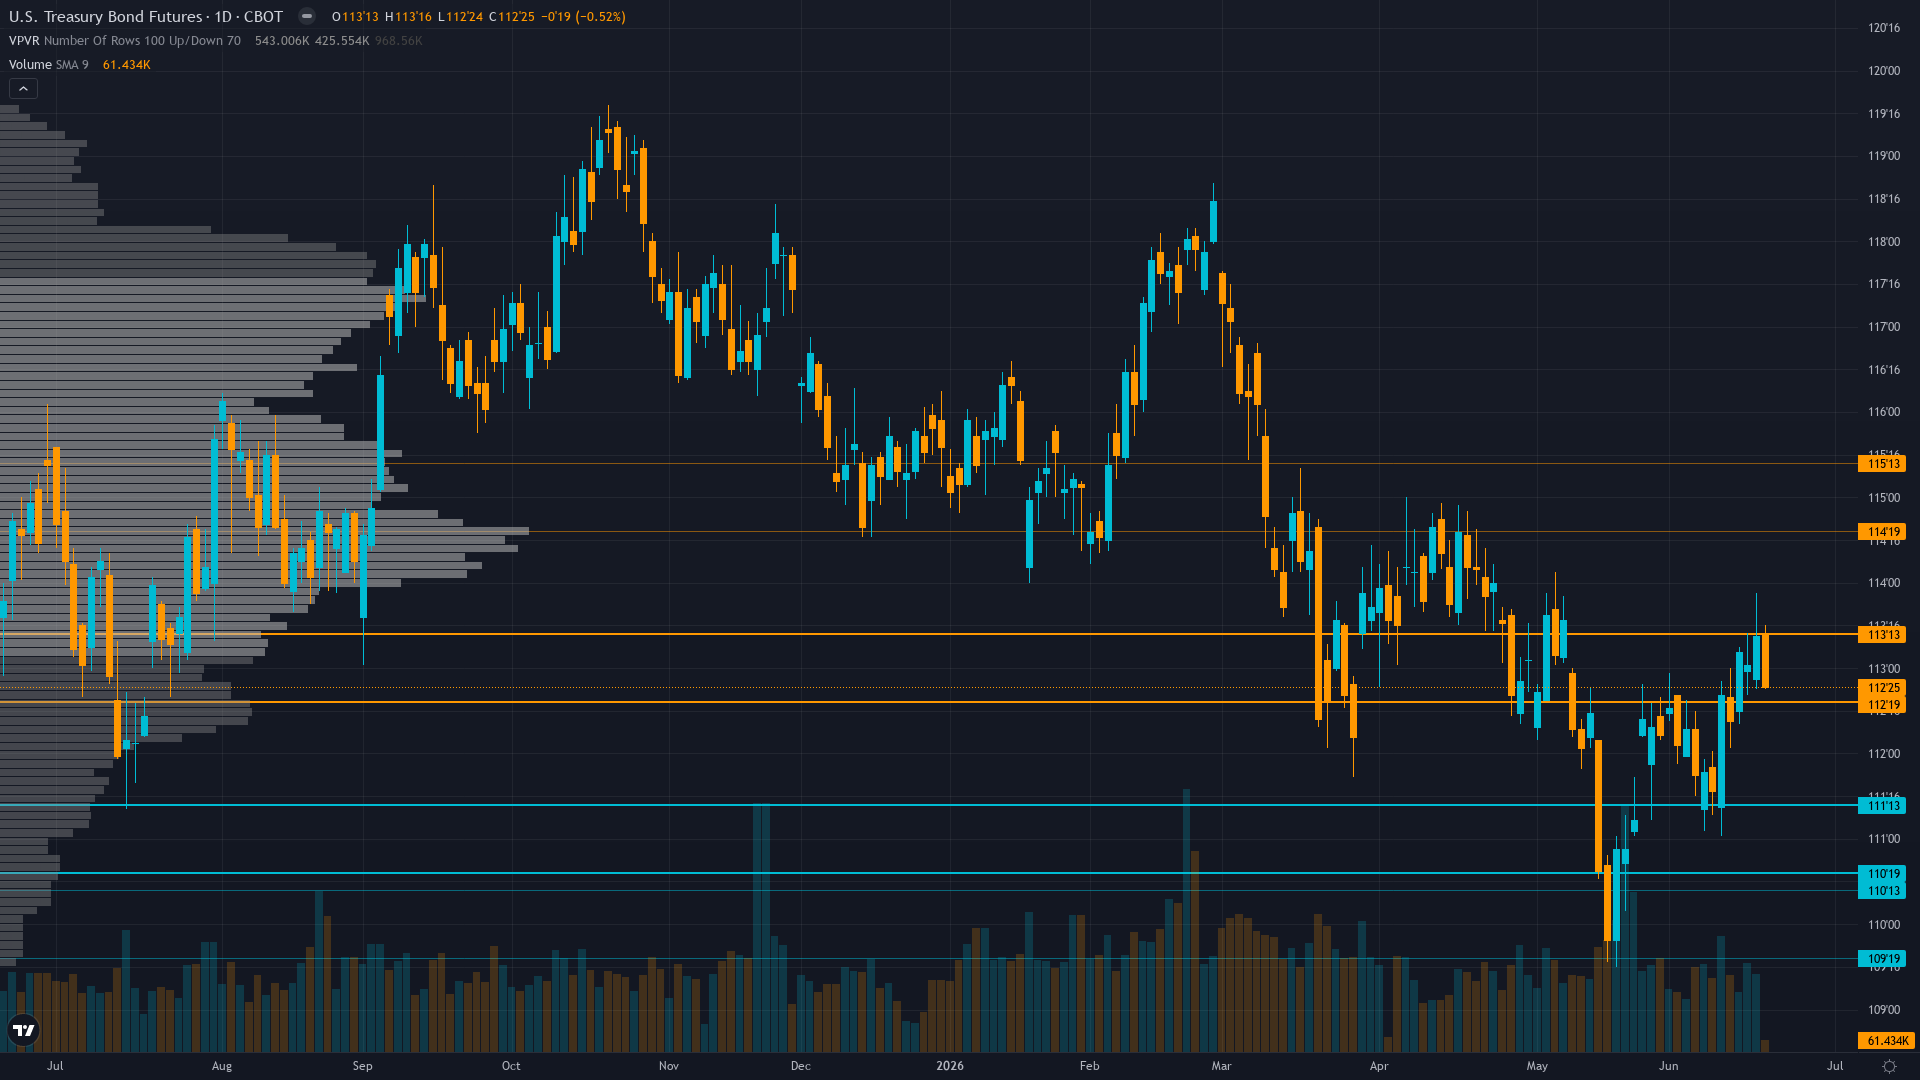
Current Price Structure
At 112.78, 30-year Treasury has inched 0.81% higher in a measured advance. Treasury bond futures is in a consolidating after Warsh FOMC rally reversal market state, requiring careful assessment of current conditions.
Downtrend since April 7 peak at 114.75 with lower highs and lower lows intact; current 112.78 sits above 111.5 immediate support but well below 114.75 resistance; TradingView Strong Sell technical rating with declining open interest at 1.87M suggesting participant deleveraging despite last week rally
With trend strength at only 3/10, any directional bias is thin and easily disrupted.
Support Zone Context
Below the current level, ZB futures has structural support where demand has historically stepped in. The reliability of these zones depends on the volume profile and the number of prior interactions.
In the current TRANSITIONAL regime - VIX at 16.78 below 20 signals contained equity volatility yet bonds rallied despite Warsh hawkish repricing creating safe-haven paradox as Fed maintained 3.50-3.75% but removed easing bias language and raised dot plot creating maximum policy uncertainty without clear directional dominance; regime characterized by profound disconnect between hawkish policy shift and rallying bond prices environment, support zones carry higher probability of holding but slower reaction times.
Ceilings & Supply Zones
Above current price, Treasury bond futures faces resistance zones where selling pressure has historically intensified. These levels represent previous supply zones, profit-taking areas, or structural barriers that price needs to overcome for continuation.
How firmly these zones hold depends on the confluence of volume, prior reactions, and the current market regime.
Where Disciplines Converge
For ZB futures, the levels that matter most are those confirmed by independent analytical approaches. When six different disciplines identify the same zone, the signal-to-noise ratio improves dramatically.
Volatility compression creating false calm environment; daily ranges compressing from 1.0-1.5 handles during May breakdown toward current 0.5-0.75 handles as MOVE declines to multi-year lows; current 112.78 price in middle of 111.5-113.5 consolidation with July 14 CPI creating near-term binary catalyst that could force violent breakout in either direction with expected 1.5-2.0 handle daily swings post-decision
How Macro Agent Desk Identifies Key Levels
Macro Agent Desk identifies key levels through a six-agent process. Each analytical discipline contributes independently — technical for structure, institutional for smart money interest, options for hedging activity, fundamentals for fair value context, sentiment for crowd positioning, and economics for catalyst timing.
What this means in practice: every key level in the full weekly report has been stress-tested across multiple independent analytical frameworks before it reaches the page.
Our paid reports include specific support and resistance levels identified by six specialist agents — technical structure, institutional positioning, options flow, fundamentals, sentiment, and economic analysis. Not just lines on a chart, but zones validated by multi-discipline confluence.
Start Free — Get the Market of the WeekFree weekly report · No credit card · Upgrade anytime


