30-Year Treasury Forecast This Week — Outlook, Drivers & Key Levels
This week's 30-Year Treasury outlook: key drivers, volatility context, risk-opportunity assessment and the week ahead.

Market Overview
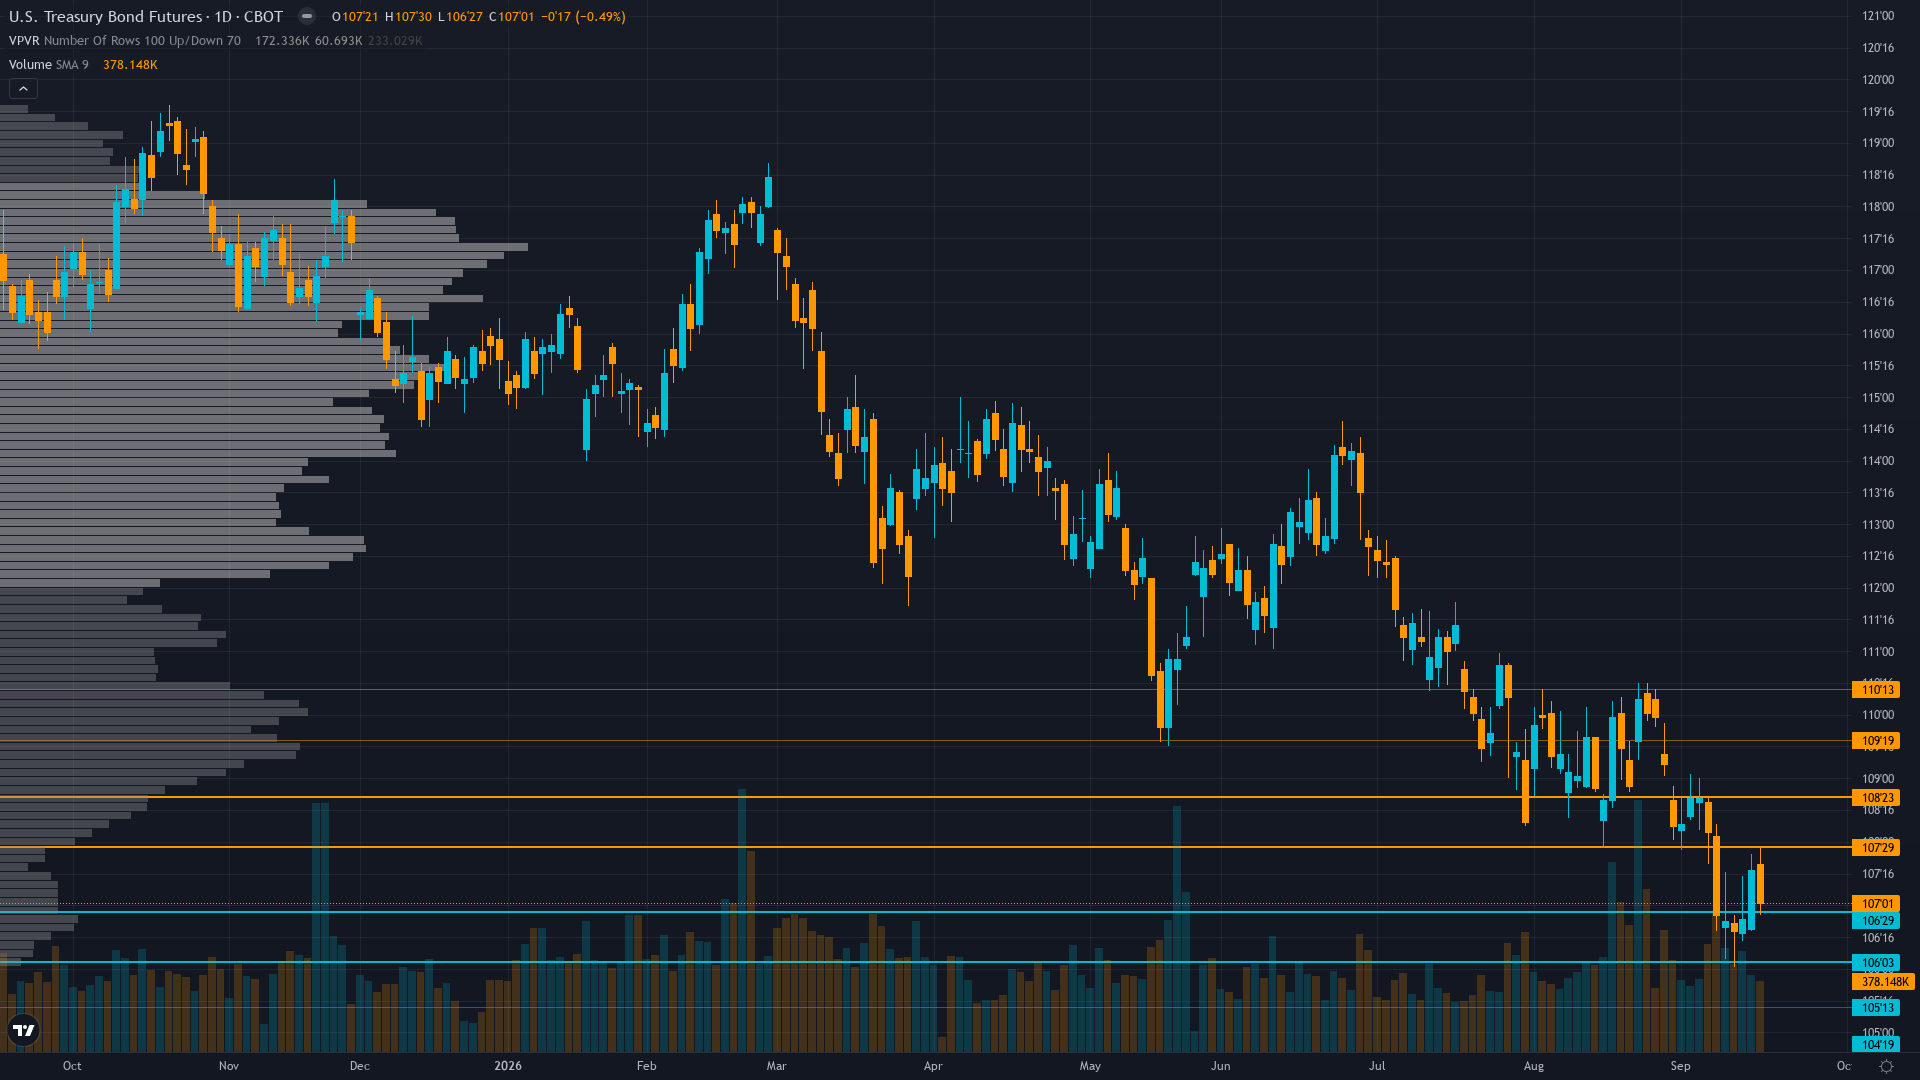
At 107.5625, 30-year Treasury has eased 0.17% in a controlled retreat. Treasury bond futures is in a breaking down market state, requiring careful assessment of current conditions.
Market pricing structural bearish duration environment with 30Y at 5.34% (19-year highs); ZB at 107.56 near 52-week low after Fed 25bp hike on Sep 16 validated hawkish repricing cycle; Bessent buyback acknowledged as partial offset but insufficient to absorb $1.97T fiscal deficit supply; market expecting Fed on hold after September hike with dot plot showing low 4% through 2027
This Week's Catalysts & Drivers
Primary driver: Fed 25bp hike on Sep 16 to 3.75-4.00% (first hike since 2023, 12-0 vote) with dot plot projecting low 4% fed funds through 2027 — the hawkish repricing cycle that began with Warsh's June 17 removal of easing bias has culminated in actual policy tightening, validating the structural bearish thesis for long duration as 30Y yields hold at 5.34% and ZB trades at the 3.1st percentile of its 52-week range
Secondary factor: CFTC COT Sep 15: non-commercial net short -203,157 contracts (3.2nd percentile of 3-year range, -10.9% of OI) with minimal weekly change of -2,640 contracts — positioning remains at extreme bearish levels near the 3-year minimum of -239,646, creating asymmetric squeeze risk that has persisted for 6+ consecutive weeks without material short covering, but the actual Fed hike has validated the bearish thesis rather than triggering a squeeze, suggesting the crowded short is structural conviction not speculative froth
Additional influence: Post-FOMC repricing dynamics: despite the actual 25bp hike on Sep 16, 30-year yields only rose 5bp from 5.29% to 5.34% over the week and the 10Y moved up 5bp to 5.01%, while the curve steepened (2s10s at 25bp) — the market had already priced this hike (Polymarket showed 51%+ probability pre-decision) and the 'sell the fact' follow-through has been measured rather than violent, indicating the yield surge from 5.19% in late August to current levels largely front-ran the decision
Economic backdrop: Fed hiked 25bps to 3.75-4.00% on Sep 16 (12-0 vote, first hike since 2023) with dot plot projecting low 4% fed funds through 2027; CPI Aug at 334.131 showing persistent inflation at 2.33%; unemployment stable at 4.1%; retail sales improved to 668,877; DXY at 100.21 strengthening +1.39% MoM; JPMorgan expects Fed on hold rest of 2026 despite inflation pressures; macro regime is DIVERGENT — equities risk-on (VIX 14.88) while long bonds price structural fiscal deterioration with 30Y at 5.34%
Fundamental assessment: 30Y yield at 5.34% (19-year highs) with FY2026 deficit tracking ~$1.97T (Bloomberg Sep 11); foreign Treasury holdings in decline (last TIC data showed -$72B monthly drop); Bessent's $4B/op buyback program (begun Sep 9) providing partial official-sector offset but insufficient to reverse structural supply-demand imbalance; Sep 15 20-year auction showed mixed demand (2.57 bid-to-cover, 52.5% indirect); term premium compressed at ~0.80% suggests inadequate compensation for duration risk given persistent fiscal supply and declining foreign demand
Technical Picture
Daily downtrend intact and accelerating: price at 107.5625 at the 3.1st percentile of 52-week range (107.1875-119.2813) after breaking below prior support at 108.31; price well below 50-day and 200-day moving averages with deeply bearish MA alignment; RSI likely oversold below 30 with momentum confirmed by -2.19% monthly decline; price just 0.38 points above the absolute 52-week low of 107.1875 — a break below would target 106.00 major psychological support; realised vol at 7.2% (20-day) within normal range for ZB but elevated relative to its 0.59% avg weekly move
At 7/10, trend strength indicates a solid directional lean without being overextended.
Risk Environment
With vol compressed to the 35th percentile, T-bond futures is in the kind of quiet period that tends to end abruptly when a catalyst arrives. Volatility is stable, with realised vol holding steady across timeframes. This equilibrium can persist but eventually resolves into expansion or contraction.
Volatility settling into low-normal regime after the Sep 16 FOMC resolution; daily ranges compressing from 1.0-1.5 handles during the pre-FOMC selloff toward 0.5-0.7 handles as the market consolidates; ZB at 107.56 just 0.38 points above the 52-week low at 107.19 creates a tactical tightrope where stop-loss cascades below 107.19 could expand vol to 1.0-1.5 handles on breakdown; given BOND category and low vol regime, effective noise floor rises to ~0.65%
Risk-Reward Assessment
Primary risk: Dovish Goolsbee/Williams/Jefferson speeches emphasizing economic fragility and signaling the Sep 16 hike may be the last — combined with extreme COT short positioning at 3.2nd percentile, this could trigger a violent short squeeze above 108.00 toward 109-110 zone as crowded speculative shorts (203K contracts) rush to cover into the Bessent buyback program ($4B/op), representing 1.5-3% upside from current 107.56 levels (Probability: medium)
Primary opportunity: Continued breakdown below the 52-week low of 107.1875 on hawkish Fed speeches reinforcing the tightening cycle, with the 30Y yield targeting 5.50-5.60% as structural fiscal supply ($1.97T deficit) and declining foreign demand overwhelm the Bessent buyback program, driving ZB toward 106.00 major support representing 1.5% additional downside from current levels (Timeframe: Next 1-2 weeks through Sep 21-23 Fed speeches and Sep 23 PMI data, with the key risk being a decisive break of 107.1875 (52-week low) that would confirm the next leg lower toward 106.00)
This week's edge: The market may be underappreciating the squeeze asymmetry embedded in the current setup: CFTC COT Sep 15 shows non-commercial net short at -203,157 contracts (3.2nd percentile, 3-year minimum is -239,646) with 6+ consecutive weeks of extreme bearish positioning that has not covered despite the Fed hike catalyst — this is either structural conviction that the selloff continues OR a record crowded trade vulnerable to a violent squeeze on any dovish signal from the Fed speech cadence this week (Goolsbee, Williams, Jefferson, Barkin Sep 21-23). The measured move of only -0.32% following the actual Fed hike (versus the -1.73% the prior week on pre-hike positioning) suggests the marginal seller is exhausted at these levels even as the structural bearish thesis remains intact. The edge lies in recognizing that the extreme short crowding (3.2nd percentile) combined with the Bessent buyback program and the fact that the actual hike produced only a modest incremental selloff creates asymmetric two-way risk: continuation requires fresh hawkish catalysts (this week's Fed speeches), while a reversal requires only an absence of new hawkish information for the squeeze to trigger. This asymmetry marginally favors restraint at current levels even while the structural trend supports the bearish direction. The desk maintains a BEARISH bias but at conviction 6 rather than higher because: (1) the extreme COT short positioning creates measurable squeeze risk that limits downside conviction, (2) the Fed hike was already priced and the post-event selloff was modest, suggesting near-term exhaustion of bearish momentum, and (3) the measured calibration context shows this desk's BEARISH calls average -0.11R over 29 attempts — breakeven-ish, not high-conviction territory.
What to Watch
Fed Goolsbee Speech at 10:30 UTC; Chicago Fed National Activity Index (Aug) at 12:30 UTC est 0.2 vs prev -0.08; Fed Williams, Jefferson, Barkin speeches Sep 22; S&P Global PMIs (Sep) on Sep 23 (Monday 21 September) sits in the medium-impact category — unlikely to single-handedly shift the picture, but capable of adding directional fuel.
The interplay between breaking down market conditions and upcoming catalysts will define this week's trading landscape for ZB futures.
This analysis covers one dimension. Our full weekly report combines six specialist agents into a single actionable briefing with directional bias, key levels, and risk-opportunity matrix.
Start Free — Get the Market of the WeekFree weekly report · No credit card · Upgrade anytime