30-Year Treasury Forecast This Week — Outlook, Drivers & Key Levels
This week's 30-Year Treasury outlook: key drivers, volatility context, risk-opportunity assessment and the week ahead.

Market Overview
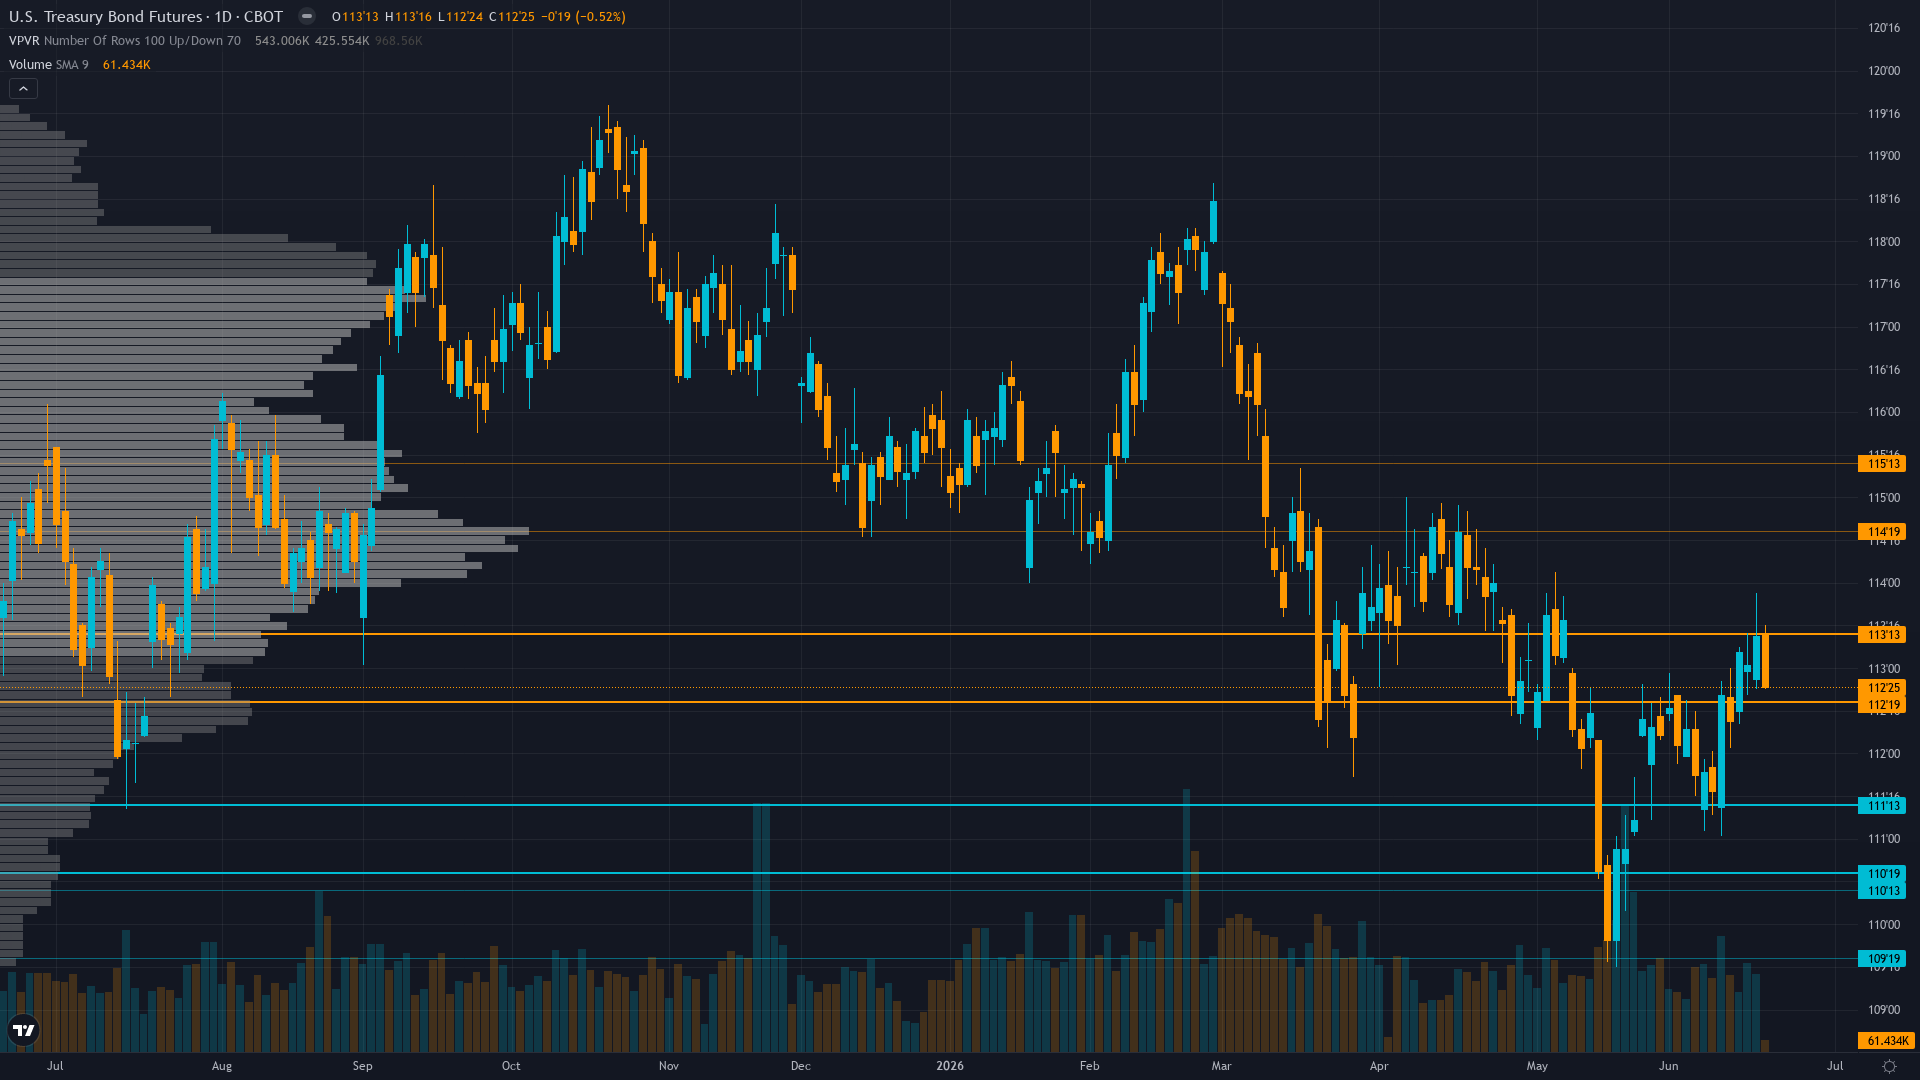
At 112.78, 30-year Treasury has inched 0.81% higher in a measured advance. Treasury bond futures is in a consolidating after Warsh FOMC rally reversal market state, requiring careful assessment of current conditions.
Market pricing Fed on hold at July 30-31 FOMC maintaining 3.50-3.75% range with <10% cut probability 2026 per Chase June 19 analysis; bonds consolidating 110-115 awaiting July 14 CPI clarity on whether Warsh's June 17 hawkish shift validated by data
This Week's Catalysts & Drivers
Primary driver: Post-input development identified: Kevin Warsh's June 17 FOMC held at 3.50-3.75% as expected but removed dovish easing bias language and raised year-end dot plot to 3.6-4.1% representing material hawkish repricing yet ZB rallied +0.81% last week (MISSED my BEARISH call) from 111.875 to 112.78125 placing consecutive miss streak at 2 triggering heightened scrutiny
Secondary factor: MOVE volatility collapse to 65.39 down 11.58% weekly and 24.04% monthly from elevated regime signals extreme complacency creating dangerous calm as market underprices implications of Warsh removing forward guidance on cuts despite June 17 hawkish shift
Additional influence: Cross-discipline conflict with Economic -2.0 (Warsh hawkish) and Technical -2.0 (downtrend intact) bearish versus Options +1.0 (compressed volatility) and Fundamental +0.5 (modest undervaluation) creating 3v3 split reducing directional clarity below 1.1 Min Signal threshold
Economic backdrop: Post-input development identified: Chase June 19 confirmed Warsh's June 17 first FOMC removed easing bias from statement and raised dot plot to 3.6-4.1% with market now pricing <10% cut probability 2026 and 3.5% hike probability by year-end; no major data until July 14 CPI creating 23-day low-information void
Fundamental assessment: Fed at 3.50-3.75% with June 17 FOMC removing dovish easing bias and raising year-end dot plot to 3.6-4.1% representing material hawkish shift from prior trajectory yet market pricing <10% cut probability 2026 already reflects this; FY2026 deficit $1.25T through May maintains structural supply pressure; 30Y yields at 4.90% approximately 16bp above long-term average 4.74% suggesting modest overvaluation yet term premium compressed at 0.67% below historical ~1.0% norm
Technical Picture
Downtrend since April 7 peak at 114.75 with lower highs and lower lows intact; current 112.78 sits above 111.5 immediate support but well below 114.75 resistance; TradingView Strong Sell technical rating with declining open interest at 1.87M suggesting participant deleveraging despite last week rally
At 3/10, trend strength is subdued, suggesting the market lacks a clear directional mandate.
Bull & Bear Case
Primary risk: Continued rally above 113.5 resistance invalidating bearish technical structure if market interprets Warsh's removal of forward guidance as constructive uncertainty rather than hawkish tilt forcing breakdown of downtrend thesis established since April 7 representing additional 1-2% upside from current 112.78 levels toward 115 resistance zone creating extended miss streak scenario (Probability: medium)
Primary opportunity: June CPI July 14 shows inflation persistence above 0.3% MoM core validating Warsh's June 17 hawkish shift was appropriate forcing market to reprice Fed terminal rate higher sending ZB below 111.5 support toward 110 major support with cascade potential representing 2-3% decline from current levels as MOVE expands from artificially compressed 65.39 toward 80-85 range creating asymmetric downside opportunity (Timeframe: Next 3-4 weeks through July 14 CPI and subsequent market repricing if data confirms inflation persistence validating Warsh hawkish stance)
This week's edge: Sub-Min-Signal environment—synthesized |signal| at 1.0 below 1.1 Min Signal threshold with no catalyst before July 14 CPI capable of producing move above requirement. Consecutive miss streak at 2 one shy of mandatory reset threshold applying maximum caution. Cross-discipline 3v3 conflict (Economic/Technical/Institutional bearish vs Options/Fundamental/Sentiment bullish) prevents directional clarity. Low-information vacuum until July 14 CPI limits edge beyond widely-recognized Warsh hawkish shift already reflected in <10% cut pricing. Probable weekly move 0.5-0.6% sits at 0.50% Noise Floor threshold insufficient for conviction above 5 creating high probability of noise-calling if directional bias issued.
Volatility Regime
Volatility for T-bond futures is at the 28th percentile over 90 days — a compressed regime where breakout potential builds beneath the surface. The vol trend is down, with contraction across timeframes creating the kind of coiled conditions that historically resolve explosively.
Volatility compression creating false calm environment; daily ranges compressing from 1.0-1.5 handles during May breakdown toward current 0.5-0.75 handles as MOVE declines to multi-year lows; current 112.78 price in middle of 111.5-113.5 consolidation with July 14 CPI creating near-term binary catalyst that could force violent breakout in either direction with expected 1.5-2.0 handle daily swings post-decision
What to Watch
The June CPI release at 8:30 AM ET critical for validating whether recent inflation persistence continues with May data already showing acceleration; if June exceeds 0.3% MoM core would cement Fed hawkish hold through Q3-Q4 2026 pressuring duration; follows Warsh's June 17 removal of easing bias creating high-stakes validation moment on Tuesday 14 July stands as the week's primary risk event — high-impact and capable of overriding the existing technical and sentiment setup.
The interplay between consolidating after Warsh FOMC rally reversal market conditions and upcoming catalysts will define this week's trading landscape for ZB futures.
This analysis covers one dimension. Our full weekly report combines six specialist agents into a single actionable briefing with directional bias, key levels, and risk-opportunity matrix.
Start Free — Get the Market of the WeekFree weekly report · No credit card · Upgrade anytime


