30-Year Treasury Forecast This Week — Outlook, Drivers & Key Levels
This week's 30-Year Treasury outlook: key drivers, volatility context, risk-opportunity assessment and the week ahead.

This Week's Starting Point
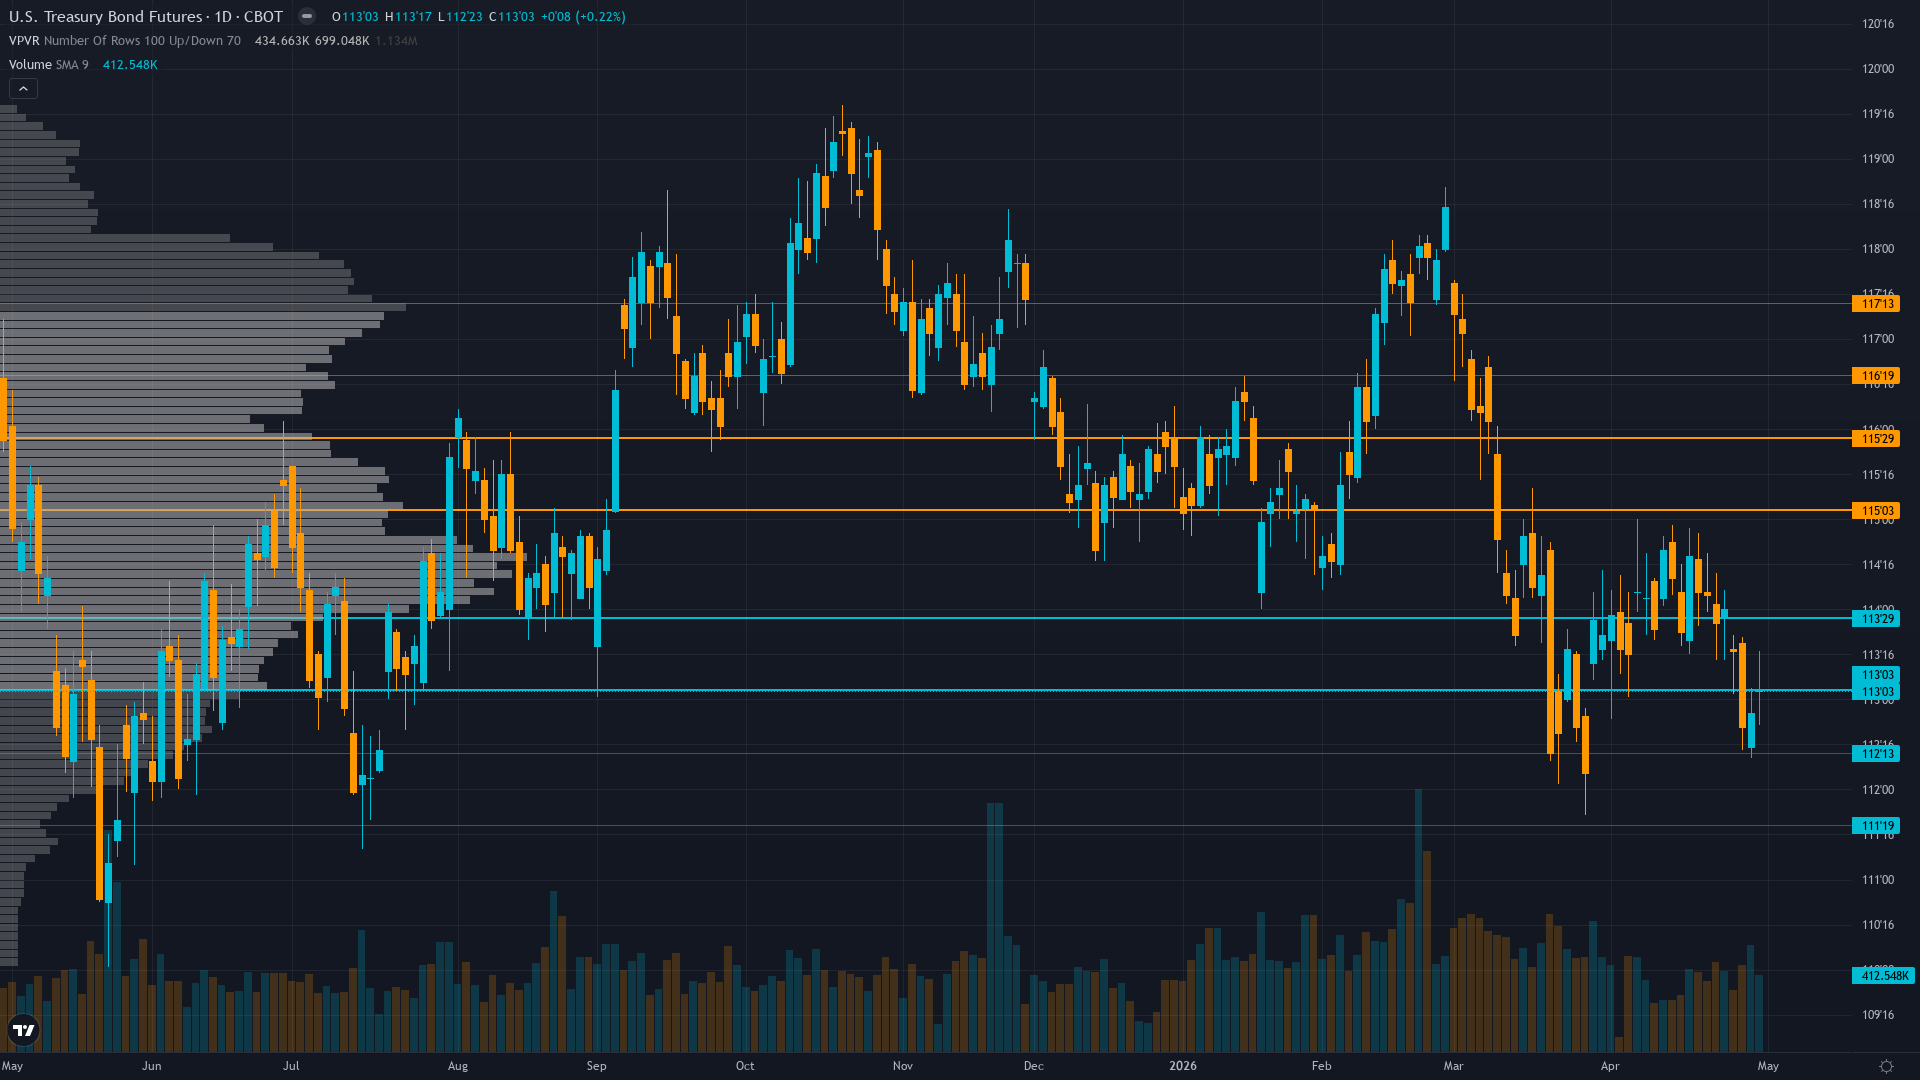
30-year Treasury is trading at 113.03, up a modest 0.22% as the market edges higher. Treasury bond futures is in a consolidating within post-FOMC breakdown structure market state, requiring careful assessment of current conditions.
Market pricing Fed on hold through mid-2026 with shallow easing trajectory maintaining 3.50-3.75% range; bonds consolidating 111-116 awaiting May employment and inflation data clarity on whether March outliers represent trend reversal or anomaly
Forces in Play
Primary driver: April 28-29 FOMC delivered hold at 3.50-3.75% with Powell confirming shallow easing trajectory creating structural bearish repricing environment yet actual post-decision market action shows ZB down -0.85% validating no relief rally materializing from widely-priced outcome
Secondary factor: Cross-discipline conflict with Economic -1.5 and Fundamental -1.5 bearish on sticky inflation and fiscal pressure contradicting Institutional +0.5 and Options +0.5 mild bullish leans from unwinding and MOVE uptick creating 3v3 split reducing directional clarity
Additional influence: Last week NO CALL MISSED with -0.85% decline from 114.09 to 113.125 placing consecutive miss streak at 1 requiring heightened caution on directional positioning particularly as probable weekly move of 0.5-0.65% sits marginally above 0.50% Noise Floor
Economic backdrop: Post-input development identified: CNBC confirmed April 29 that 10-year yields jumped after FOMC hold at 3.50-3.75% with Powell stating he will remain on Board indefinitely despite May term end creating leadership continuity; March CPI 3.3% spike and sticky core 2.5% maintaining hawkish hold bias through mid-2026
Fundamental assessment: Fed at 3.50-3.75% after April 28-29 hold maintaining terminal rate guidance near 3% creating structurally bearish environment; March CPI spike to 3.3% from 2.4% removed rate cut urgency despite labor softness while FY2026 deficit $1.2T H1 maintains relentless supply pressure
Technical Landscape
Range-bound 111-116.5 consolidation after last week breakdown with price at 113.03 below 114 pivot; former 116.5 support now formidable resistance with stalled momentum and declining open interest at 1.81M suggesting participant deleveraging
Trend strength is low at 3/10, indicating weak directional conviction and potential for range-bound behaviour.
Risk-Reward Assessment
Primary risk: May employment data shows continued labor market resilience confirming March NFP +178k was not anomaly combined with May CPI showing inflation persistence above 2.5% forcing market to reprice Fed terminal rate higher sending ZB below 112.5 support toward 111 major support with cascade potential representing additional 1.5-2% decline (Probability: medium)
Primary opportunity: April employment or May CPI data shows material deterioration contradicting March outliers forcing Fed pivot acknowledgment triggering violent short covering rally above 114.5 resistance toward 116.5 zone from current compressed MOVE at 70.4 creating asymmetric upside (Timeframe: Next 1-3 weeks through May 9 NFP and mid-May CPI releases if data deteriorates significantly or MOVE volatility expansion from 70.4 accelerates creating 15-20% spike to 85-90 range)
This week's edge: Market potentially underpricing probability that April employment data reverting to weakness after March NFP +178k outlier combined with cross-discipline conflict showing 3v3 split suggesting genuine uncertainty not captured in current 113.03 consolidation; alternatively market may be underpricing persistence of inflation above 2.5% core combined with labor resilience creating extended hawkish hold scenario sending yields higher toward 112 support
Risk Environment
With vol compressed to the 35th percentile, T-bond futures is in the kind of quiet period that tends to end abruptly when a catalyst arrives. Volatility is stable, with realised vol holding steady across timeframes. This equilibrium can persist but eventually resolves into expansion or contraction.
Volatility stabilization creating moderating environment; daily ranges compressing from 1.0-1.5 handles toward 0.5-0.75 handles as MOVE stabilizes at 70.4; current 113.03 price in middle of 112.5-114.5 consolidation with May 9 NFP creating near-term binary catalyst that could force breakout in either direction
Looking Forward
All eyes turn to April employment report (NFP) release critical for confirming whether March +178k outlier represents trend reversal or anomaly forcing Fed to choose between mandates of labor market support versus inflation persistence on Saturday 9 May, which carries enough weight to force a decisive directional move.
The week ahead for Treasury bond futures hinges on whether the prevailing consolidating within post-FOMC breakdown structure regime can absorb the scheduled catalysts without a regime shift.
This analysis covers one dimension. Our full weekly report combines six specialist agents into a single actionable briefing with directional bias, key levels, and risk-opportunity matrix.
Start Free — Get the Market of the WeekFree weekly report · No credit card · Upgrade anytime


