Wheat (ZW) — Sharp technical breakdown from March 19 intraday high near 609 to current…
Cautiously bearish following March rally reversal with market viewing advance as short-covering event within structural bear market expecting mean reversion toward 575-590 once weather premium fully dissipates and positioning dynamics stabilize

Cautiously bearish following March rally reversal with market viewing advance as short-covering event within structural bear market expecting mean reversion toward 575-590 once weather premium fully dissipates and positioning dynamics stabilize
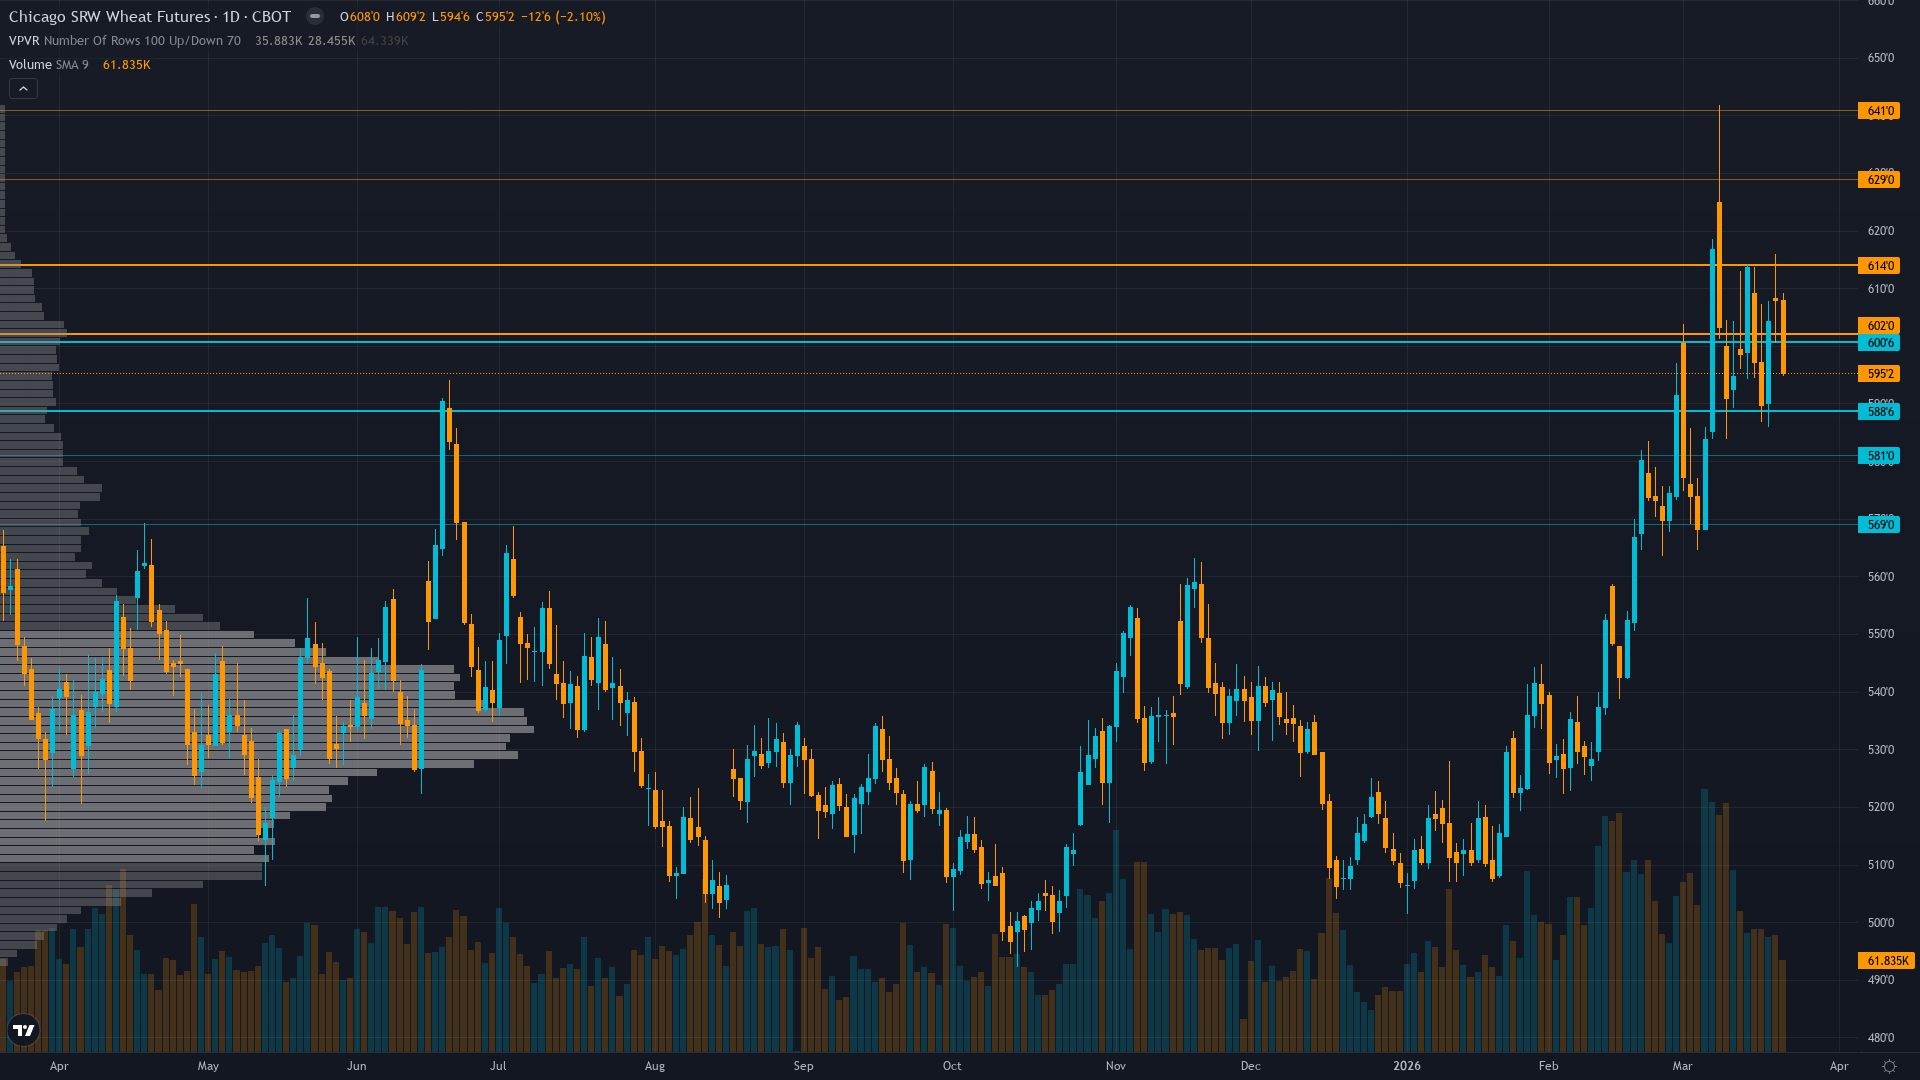
Sharp technical breakdown from March 19 intraday high near 609 to current 595.25 erasing rally gains and confirming failed breakout structure with declining open interest signaling weakening conviction despite structural oversupply fundamentals remaining dominant
USD strength headwind intensifying as DXY held near 99.5 following March geopolitical shock creating direct export competitiveness pressure offsetting strong 900 million bushel US export forecast floor
Plains drought concerns from March 19 rally driver fading as market digests March 10 WASDE showing minimal changes and no production downgrades despite early dormancy break creating March-April freeze vulnerability window
| ▼ Resistance Zone 2 | 630.00 – 640.00 |
| ▼ Resistance Zone 1 | 603.00 – 613.00 |
| ─ Pivot Area | ~595.25 |
| ▲ Support Zone 1 | 589.75 – 599.75 |
| ▲ Support Zone 2 | 570.00 – 580.00 |
Failed breakout at 609 resistance followed by sharp 2.1% decline to 595.25 confirming rally exhaustion with declining open interest at 230,820 contracts signaling weakening trend participation and potential for retest of 575-580 support zone
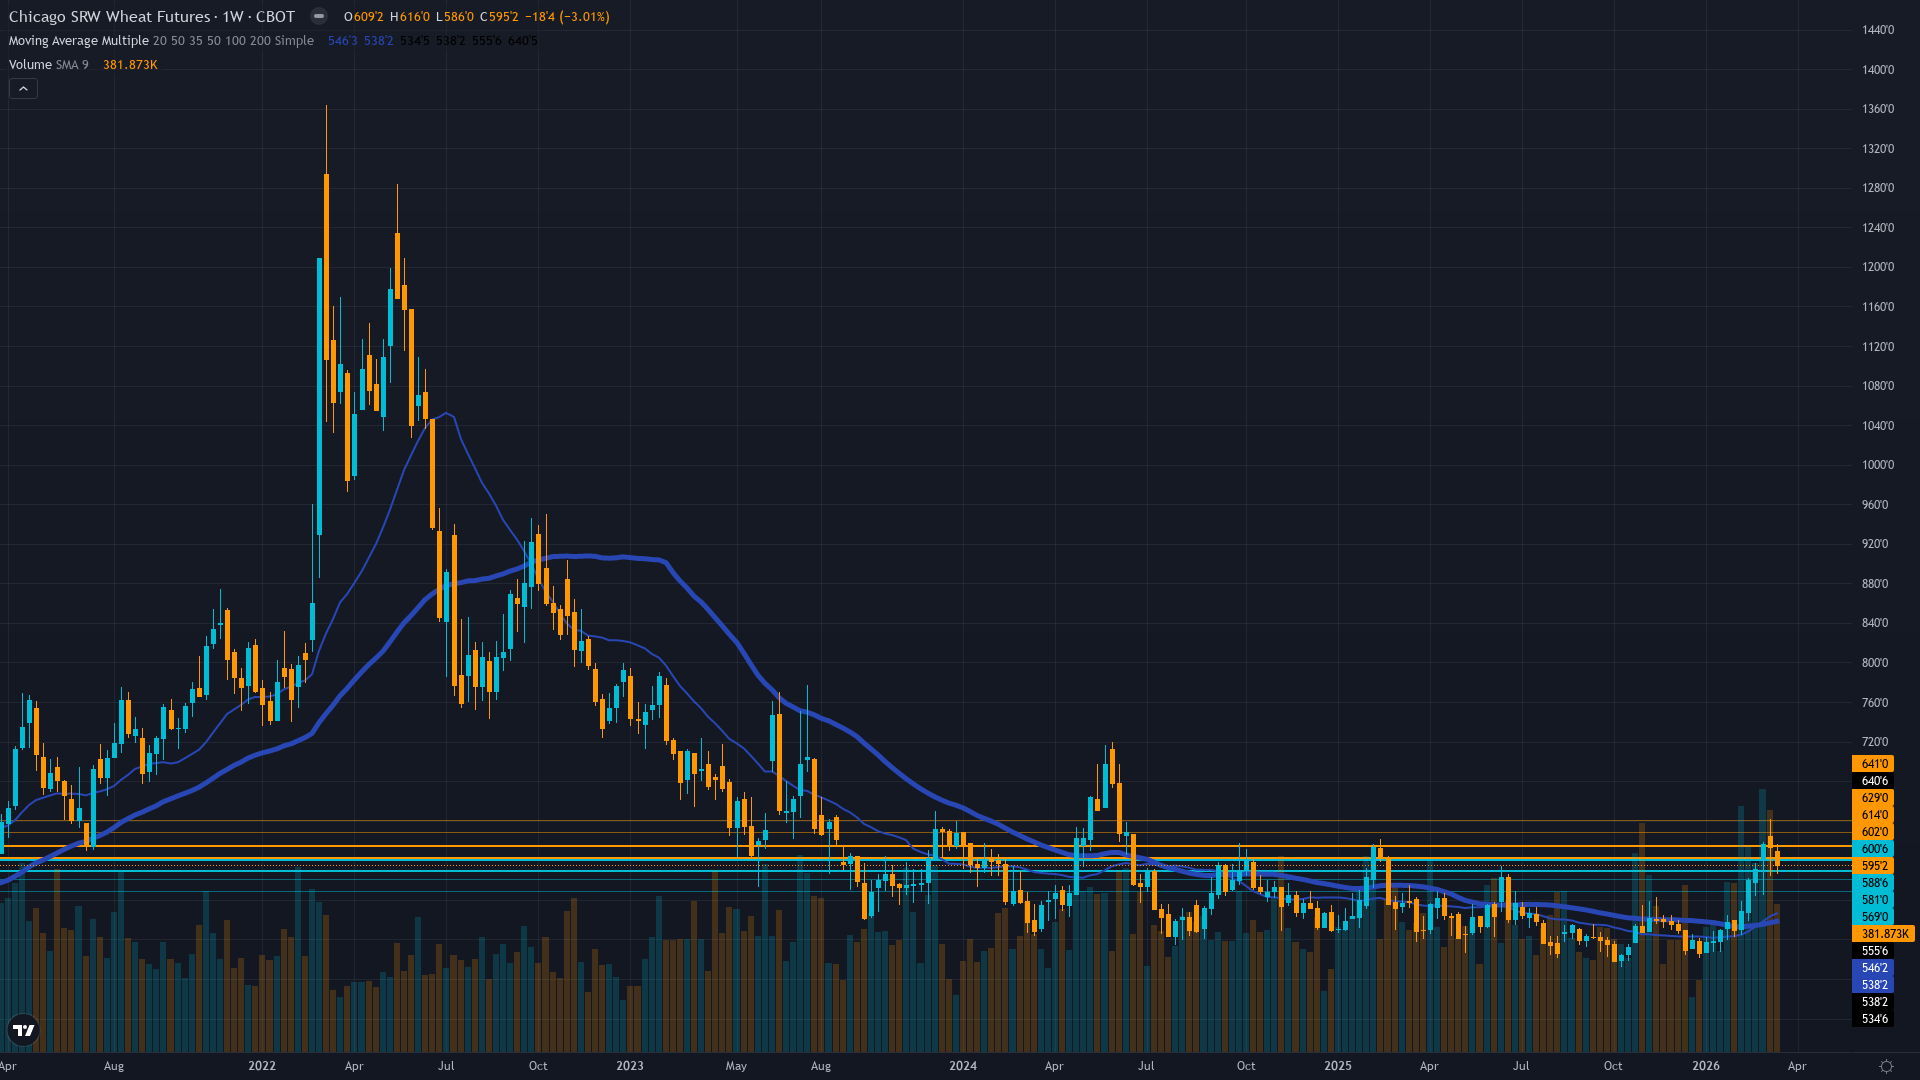
Overwhelmingly bearish with global stocks at record 277.5 MMT and 33.7% stocks-to-use ratio yet market holding above 590 suggests worst-case scenarios fully discounted after October capitulation to 492 lows with strong US export pace providing tangible floor
Spec shorts reduced to 17,758 contracts from extreme 109,483 peak representing 84% covering exhaustion removing primary fuel for further rally with positioning now near neutral creating two-way risk
Implied volatility elevated at 37.79% in May 2026 options up 58% from December levels reflecting binary event premium and continued two-way risk though thin options markets limit directional signal clarity
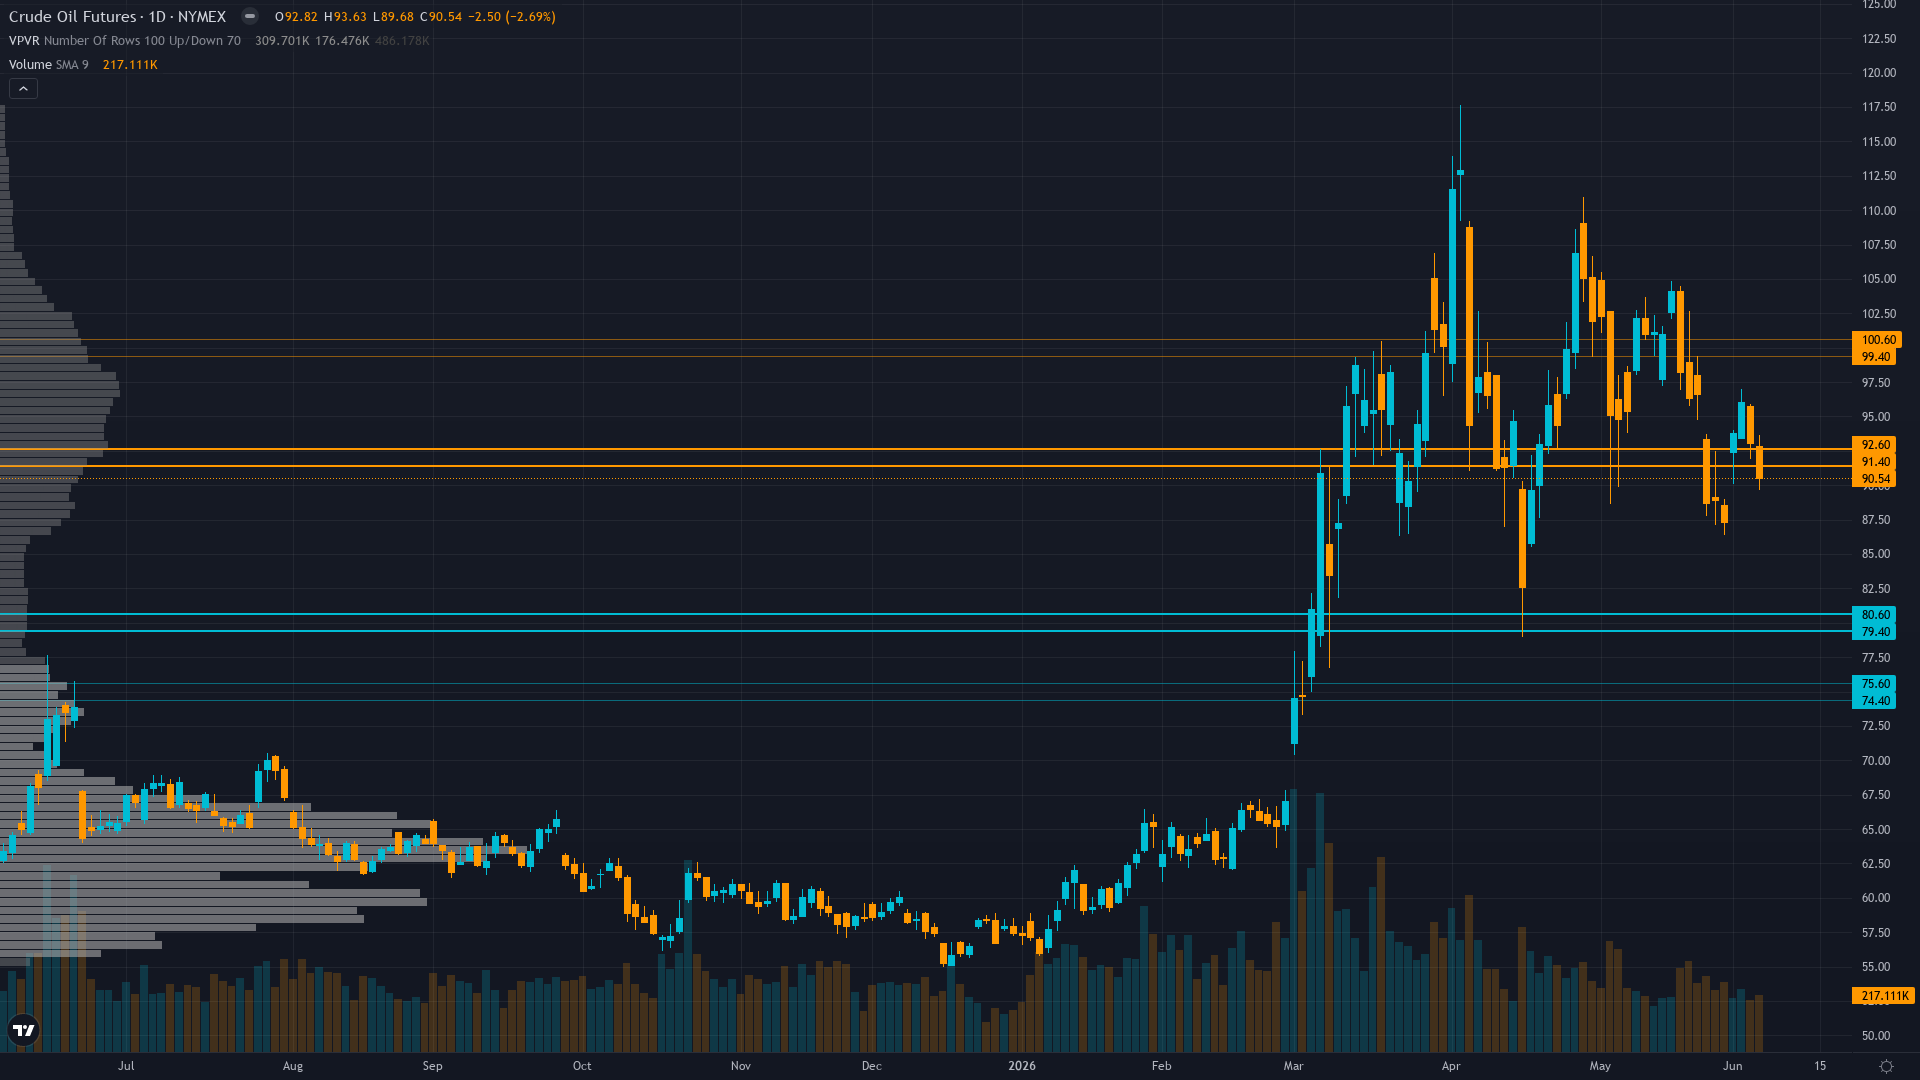
Transitional macro regime with VIX at 26.78 signaling elevated fear USD strength at 99.5 creating export headwinds and crude oil spike to 92/bbl following Iran-Hormuz conflict raising input costs offsetting stable agricultural demand environment
Slightly inverted - short-term volatility elevated at 28.5% versus medium-term 26.5% following February-March rally and WASDE event risk with term structure suggesting elevated two-way action persists but expansion phase may be maturing
Weather-driven rallies from extreme short positioning historically produce 50-80% volatility expansion over 4-6 weeks with current expansion from 24% to 32% consistent with mature stages suggesting peak volatility likely achieved unless fresh catalyst emerges from April WASDE or late March freeze event
Volatility expanded from January-February consolidation following Arctic blast and WASDE events now stabilizing in high regime with potential for 15-20% compression if market enters sustained consolidation without fresh weather catalyst or modest additional expansion if directional breakout occurs below 590 or above 610
Daily ranges expanded from compressed 10-16 cents during late 2025 consolidation to current 15-25 cent action requiring wider stops with breakdown below 594 or recovery above 608 triggering accelerated moves given failed breakout structure and elevated volatility environment
Elevated volatility in high regime creates balanced two-way risk where fresh bullish catalyst from freeze event or geopolitical disruption could drive 5-8% rally toward 630-650 while downside to 575-590 appears increasingly probable absent catalyst given positioning exhaustion and USD headwinds with stable high volatility suggesting ranging behavior most likely near-term between 575-610 boundaries
|
⚠️ Primary Risk
Continuation of breakdown below 594 support toward retesting 575-580 zone as short-covering exhaustion combines with USD strength headwinds structural oversupply narrative reasserting dominance and absence of fresh bullish catalysts following March 19 rally failure Probability: HIGH
|
✦ Primary Opportunity
Late March-April freeze event damages winter wheat that broke dormancy early in late February triggering renewed weather premium and short-covering toward 620-635 range as March-April historically represents peak freeze vulnerability window for crops in active growth Timeframe: Next 2-4 weeks through April WASDE and critical March-April weather window
|
Post-input development identified: Current price is 595.25 as of March 21, 2026, confirming the Technical Analyst's data showing price opened 608 and fell to 595.75 close representing a significant -2.10% decline in the session extending the breakdown from March 19 intraday high near 609.25. This marks a critical reversal from last week's BULLISH conviction 8 call which MISSED as price fell from Monday open 613.75 to Friday close 595.75 (-2.93%). ZW wheat futures stand at a defining inflection point on March 22, 2026, trading at 595.25 cents per bushel after experiencing a spectacular failure of the February-March rally that reached 618.50 near 52-week highs.
The market has surrendered the entire post-WASDE advance, falling 3.8% from the March 19 peak in just three sessions. Current macro regime classification: TRANSITIONAL with mixed signals showing VIX elevated at 26.78 (above 25 fear threshold) indicating heightened investor nervousness, USD strengthening to 99.5 DXY following geopolitical safe-haven flows from Iran-Hormuz conflict, and crude oil spiking to 92/bbl creating input cost pressures. For agricultural commodities, the dominant headwind is USD strength which directly impairs US wheat export competitiveness versus Argentina, Russia, and Black Sea suppliers.
The fundamental backdrop remains dominated by structural oversupply with global ending stocks at 277.5 million metric tons representing a five-year high and 33.7% stocks-to-use ratio, yet the market holding above 590 suggests worst-case scenarios are now fully discounted after October 2025 capitulation to 492.25 lows. The positioning dynamics reveal the rally's primary driver has been exhausted: spec shorts collapsed from 109,483 contracts on January 7 to 25,800 as of March 3 (77% reduction), then to 17,758 in latest data—an 84% total unwind removing asymmetric squeeze fuel.
Technical structure shows the failed breakout above 608-609 resistance with declining open interest at 230,820 contracts suggesting weakening trend conviction. The March 9 short-squeeze rally to 618+ has completely reversed, and the subsequent breakdown to 595.25 confirms resistance at prior highs. The critical wildcard that provided February-March rally fuel—Plains drought conditions deteriorating with Kansas coverage at 8.4% and early dormancy break creating March-April freeze vulnerability—remains active but is being increasingly discounted by the market as weather forecasts show no imminent arctic blast and the freeze window narrows with each passing week.
Trading context suggests probable weekly move approaching the 0.75% noise threshold for agricultural assets. Thesis Health Score calculation: Last week BULLISH call MISSED with -2.93% move, and of last 4 graded weeks 2 moved contrary to bullish bias (this week and week of March 14). Net cumulative 4-week move is -2.93% contrary to prior BULLISH bias exceeding 2x the 1.29% average weekly move triggering -2 penalty. Consecutive BULLISH streak reached 2 weeks before this downgrade (below 5-week review threshold).
Total Thesis Health penalties: -1 for last MISSED, -0.5x2 for 2 contrary weeks, -2 for net move penalty = -4 points from base conviction bringing score below 5 threshold requiring NO CALL or NEUTRAL. Devil's advocate argues the March-April freeze risk from early dormancy break remains underappreciated by market with late-season arctic air historically causing severe damage to crops in active growth yet current positioning exhaustion and USD headwinds suggest limited edge for directional call at current levels creating appropriate NEUTRAL stance given noise threshold proximity and catalyst void between now and April 9 WASDE.
| Week | Bias | Confidence | Result |
|---|---|---|---|
| March 20, 2026 | NO CALL | 5/10 | ➖ |
| March 14, 2026 | BULLISH | 8/10 | ❌ |
| March 6, 2026 | BULLISH | 8/10 | ✅ |
| February 27, 2026 | BULLISH | 8/10 | ✅ |
| February 21, 2026 | NO CALL | 7/10 | ➖ |
| February 13, 2026 | NO CALL | 7/10 | ➖ |
| February 8, 2026 | NO CALL | 7/10 | ➖ |
| February 1, 2026 | NO CALL | 7/10 | ➖ |
| January 25, 2026 | NO CALL | 7/10 | ➖ |
| January 11, 2026 | NO CALL | 7/10 | ➖ |
| January 4, 2026 | BEARISH | 7/10 | ❌ |
| December 28, 2025 | BEARISH | 7/10 | ✅ |
📋 PROMPT-READY CONTEXT
Copy this entire block into any AI chat for follow-up analysis
▼ Expand
MACRO AGENT DESK — WEEKLY INTELLIGENCE BRIEFING
═════════════════════════════════════════════════
Asset: Wheat (ZW)
Report Date: March 22, 2026

── DIRECTIONAL BIAS ─────────────────────────────
Call: NO CALL
Confidence: 5/10
Signal: NO DIRECTIONAL CALL THIS WEEK
MAD Index: 22 (MOSTLY ALIGNED)

── MARKET CONTEXT ───────────────────────────────
State: BREAKING DOWN
Regime: BREAKDOWN FROM CONSOLIDATION
Sentiment: FEAR

── WHAT THE MARKET SEES ─────────────────────────
Cautiously bearish following March rally reversal with market viewing advance as short-covering event within structural bear market expecting mean reversion toward 575-590 once weather premium fully dissipates and positioning dynamics stabilize

── WHAT THE MARKET IS MISSING ───────────────────
Market may be underestimating March-April freeze risk from unusually early dormancy break in late February 2026 creating tail-risk scenario for severe crop damage if arctic air returns yet positioning exhaustion and USD headwinds combined with absence of fresh catalysts and two consecutive MISSED calls requiring Thesis Health Score downgrade suggest NEUTRAL stance appropriate as probable weekly move approaches 0.75% noise threshold with conviction insufficient for directional call

── KEY DRIVERS ──────────────────────────────────
1. Sharp technical breakdown from March 19 intraday high near 609 to current 595.25 erasing rally gains and confirming failed breakout structure with declining open interest signaling weakening conviction despite structural oversupply fundamentals remaining dominant
2. USD strength headwind intensifying as DXY held near 99.5 following March geopolitical shock creating direct export competitiveness pressure offsetting strong 900 million bushel US export forecast floor
3. Plains drought concerns from March 19 rally driver fading as market digests March 10 WASDE showing minimal changes and no production downgrades despite early dormancy break creating March-April freeze vulnerability window

── KEY ZONES ────────────────────────────────────
Resistance 2: 630.00 – 640.00
Resistance 1: 603.00 – 613.00
Pivot: ~595.25
Support 1: 589.75 – 599.75
Support 2: 570.00 – 580.00

── DISCIPLINE BIASES ────────────────────────────
Technical: BEARISH
Fundamental: BEARISH
Institutional: NO CALL
Options: NO CALL
Economic: BEARISH
Sentiment: BULLISH

── TECHNICAL STRUCTURE ──────────────────────────
Failed breakout at 609 resistance followed by sharp 2.1% decline to 595.25 confirming rally exhaustion with declining open interest at 230,820 contracts signaling weakening trend participation and potential for retest of 575-580 support zone

── FUNDAMENTAL ASSESSMENT ───────────────────────
Overwhelmingly bearish with global stocks at record 277.5 MMT and 33.7% stocks-to-use ratio yet market holding above 590 suggests worst-case scenarios fully discounted after October capitulation to 492 lows with strong US export pace providing tangible floor

── INSTITUTIONAL POSITIONING ────────────────────
Spec shorts reduced to 17,758 contracts from extreme 109,483 peak representing 84% covering exhaustion removing primary fuel for further rally with positioning now near neutral creating two-way risk

── OPTIONS FLOW ─────────────────────────────────
Implied volatility elevated at 37.79% in May 2026 options up 58% from December levels reflecting binary event premium and continued two-way risk though thin options markets limit directional signal clarity

── ECONOMIC BACKDROP ────────────────────────────
Transitional macro regime with VIX at 26.78 signaling elevated fear USD strength at 99.5 creating export headwinds and crude oil spike to 92/bbl following Iran-Hormuz conflict raising input costs offsetting stable agricultural demand environment

── VOLATILITY REGIME ────────────────────────────
Regime: HIGH
Percentile: 68th
Trend: Stable —
Days in Regime: 14
Term Structure: slightly inverted - short-term volatility elevated at 28.5% versus medium-term 26.5% following February-March rally and WASDE event risk with term structure suggesting elevated two-way action persists but expansion phase may be maturing
Historical Pattern: Weather-driven rallies from extreme short positioning historically produce 50-80% volatility expansion over 4-6 weeks with current expansion from 24% to 32% consistent with mature stages suggesting peak volatility likely achieved unless fresh catalyst emerges from April WASDE or late March freeze event
Outlook: Volatility expanded from January-February consolidation following Arctic blast and WASDE events now stabilizing in high regime with potential for 15-20% compression if market enters sustained consolidation without fresh weather catalyst or modest additional expansion if directional breakout occurs below 590 or above 610
Trading Context: Daily ranges expanded from compressed 10-16 cents during late 2025 consolidation to current 15-25 cent action requiring wider stops with breakdown below 594 or recovery above 608 triggering accelerated moves given failed breakout structure and elevated volatility environment
Vol Risk/Opportunity: Elevated volatility in high regime creates balanced two-way risk where fresh bullish catalyst from freeze event or geopolitical disruption could drive 5-8% rally toward 630-650 while downside to 575-590 appears increasingly probable absent catalyst given positioning exhaustion and USD headwinds with stable high volatility suggesting ranging behavior most likely near-term between 575-610 boundaries

── PRIMARY RISK ─────────────────────────────────
Continuation of breakdown below 594 support toward retesting 575-580 zone as short-covering exhaustion combines with USD strength headwinds structural oversupply narrative reasserting dominance and absence of fresh bullish catalysts following March 19 rally failure
Probability: HIGH

── PRIMARY OPPORTUNITY ──────────────────────────
Late March-April freeze event damages winter wheat that broke dormancy early in late February triggering renewed weather premium and short-covering toward 620-635 range as March-April historically represents peak freeze vulnerability window for crops in active growth
Timeframe: Next 2-4 weeks through April WASDE and critical March-April weather window

── NEXT CATALYST ────────────────────────────────
Date: April 9, 2026
Event: USDA April 2026 WASDE Report with winter wheat acreage estimates production forecasts and condition assessments incorporating weather-adjusted outlook following March early dormancy break and drought concerns
Expected Impact: MEDIUM

═════════════════════════════════════════════════
Source: Macro Agent Desk (macroagentdesk.com)
═════════════════════════════════════════════════

── FULL ANALYSIS ────────────────────────────────
Post-input development identified: Current price is 595.25 as of March 21, 2026, confirming the Technical Analyst's data showing price opened 608 and fell to 595.75 close representing a significant -2.10% decline in the session extending the breakdown from March 19 intraday high near 609.25. This marks a critical reversal from last week's BULLISH conviction 8 call which MISSED as price fell from Monday open 613.75 to Friday close 595.75 (-2.93%). ZW wheat futures stand at a defining inflection point on March 22, 2026, trading at 595.25 cents per bushel after experiencing a spectacular failure of the February-March rally that reached 618.50 near 52-week highs. The market has surrendered the entire post-WASDE advance, falling 3.8% from the March 19 peak in just three sessions. Current macro regime classification: TRANSITIONAL with mixed signals showing VIX elevated at 26.78 (above 25 fear threshold) indicating heightened investor nervousness, USD strengthening to 99.5 DXY following geopolitical safe-haven flows from Iran-Hormuz conflict, and crude oil spiking to 92/bbl creating input cost pressures. For agricultural commodities, the dominant headwind is USD strength which directly impairs US wheat export competitiveness versus Argentina, Russia, and Black Sea suppliers. The fundamental backdrop remains dominated by structural oversupply with global ending stocks at 277.5 million metric tons representing a five-year high and 33.7% stocks-to-use ratio, yet the market holding above 590 suggests worst-case scenarios are now fully discounted after October 2025 capitulation to 492.25 lows. The positioning dynamics reveal the rally's primary driver has been exhausted: spec shorts collapsed from 109,483 contracts on January 7 to 25,800 as of March 3 (77% reduction), then to 17,758 in latest data—an 84% total unwind removing asymmetric squeeze fuel. Technical structure shows the failed breakout above 608-609 resistance with declining open interest at 230,820 contracts suggesting weakening trend conviction. The March 9 short-squeeze rally to 618+ has completely reversed, and the subsequent breakdown to 595.25 confirms resistance at prior highs. The critical wildcard that provided February-March rally fuel—Plains drought conditions deteriorating with Kansas coverage at 8.4% and early dormancy break creating March-April freeze vulnerability—remains active but is being increasingly discounted by the market as weather forecasts show no imminent arctic blast and the freeze window narrows with each passing week. Trading context suggests probable weekly move approaching the 0.75% noise threshold for agricultural assets. Thesis Health Score calculation: Last week BULLISH call MISSED with -2.93% move, and of last 4 graded weeks 2 moved contrary to bullish bias (this week and week of March 14). Net cumulative 4-week move is -2.93% contrary to prior BULLISH bias exceeding 2x the 1.29% average weekly move triggering -2 penalty. Consecutive BULLISH streak reached 2 weeks before this downgrade (below 5-week review threshold). Total Thesis Health penalties: -1 for last MISSED, -0.5x2 for 2 contrary weeks, -2 for net move penalty = -4 points from base conviction bringing score below 5 threshold requiring NO CALL or NEUTRAL. Devil's advocate argues the March-April freeze risk from early dormancy break remains underappreciated by market with late-season arctic air historically causing severe damage to crops in active growth yet current positioning exhaustion and USD headwinds suggest limited edge for directional call at current levels creating appropriate NEUTRAL stance given noise threshold proximity and catalyst void between now and April 9 WASDE.