Wheat (ZW) — 2.5 between 575 support and 600 resistance with 8/10 confidence
Cautiously bullish on February-March rally from extreme October oversold levels with Arctic blast and early dormancy break providing genuine supply catalyst yet skeptical about sustainability above 600 given structural oversupply fundamentals

Cautiously bullish on February-March rally from extreme October oversold levels with Arctic blast and early dormancy break providing genuine supply catalyst yet skeptical about sustainability above 600 given structural oversupply fundamentals
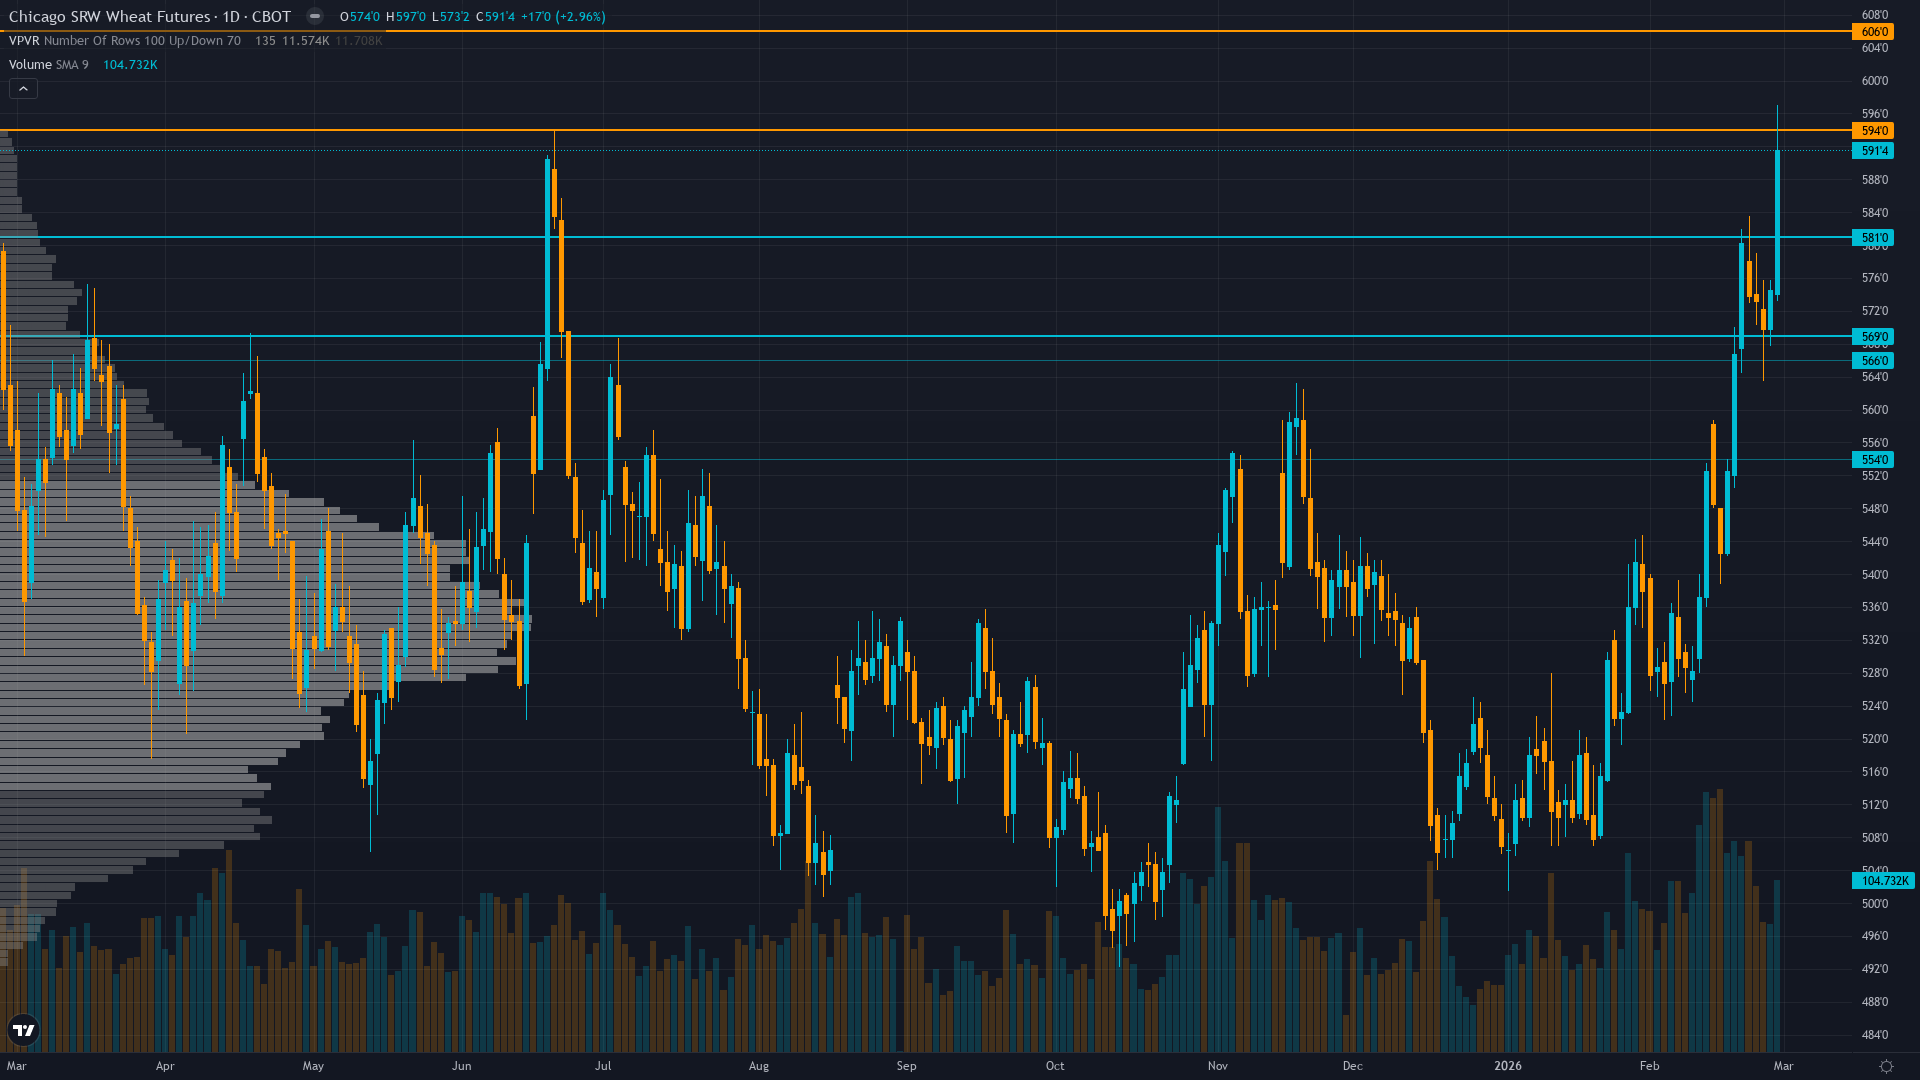
Explosive rally continuation from February Arctic blast winterkill fears with price extending 20% from October 2025 capitulation lows near 492 as late-February moisture concerns and geopolitical risk premium re-emerge
Spec short positioning remains elevated near 80,000-90,000 contracts creating continued asymmetric fuel for squeeze dynamics as March typically strong seasonal period maintains momentum
Late-February rain in Plains temporarily eased immediate drought stress yet warm weather breaking winter wheat dormancy early raises March-April freeze risk creating weather premium into March 10 WASDE
| ▲ Resistance Zone 2 | 617.00 – 627.00 |
| ▲ Resistance Zone 1 | 595.00 – 605.00 |
| ─ Pivot Area | ~591.50 |
| ▼ Support Zone 1 | 570.00 – 580.00 |
| ▼ Support Zone 2 | 555.00 – 565.00 |
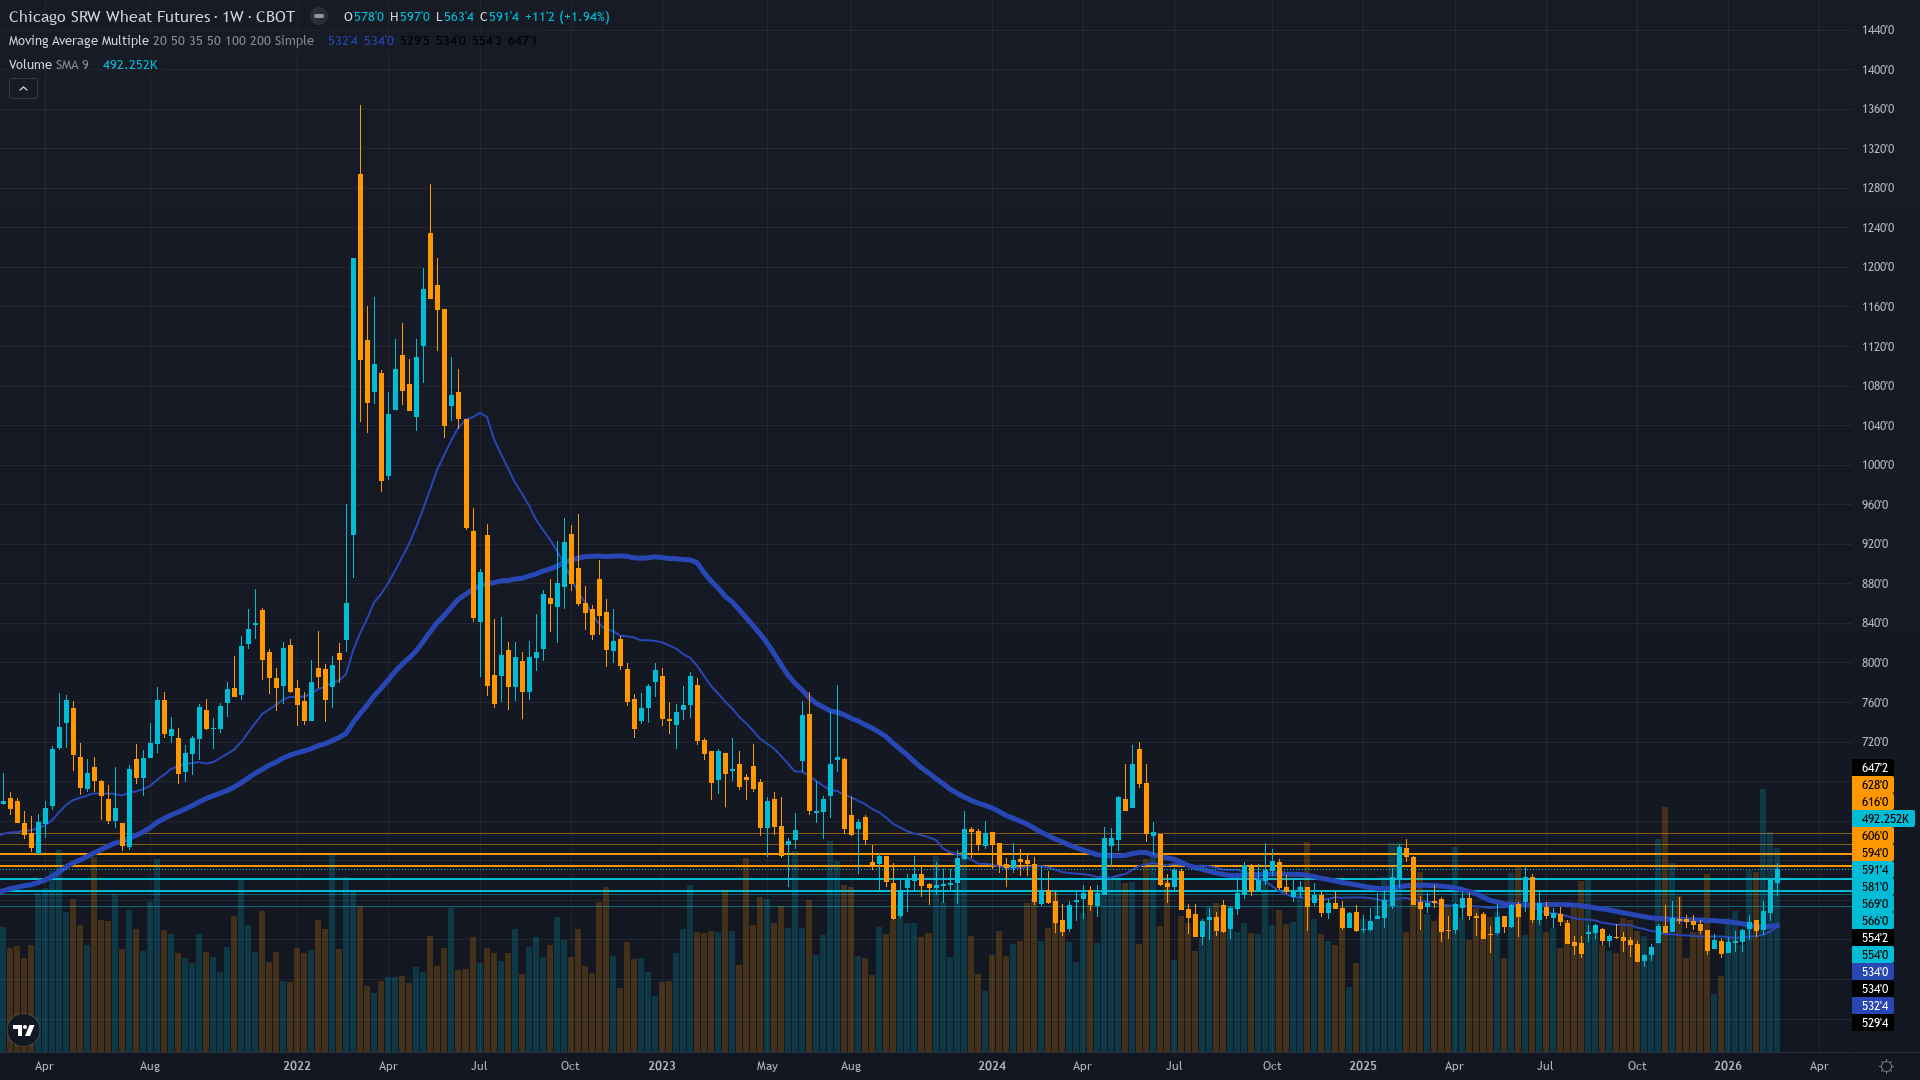
Strong 20% rally from October 492 lows to 591.5 breaking above all major resistance with momentum sustained and technical indicators showing strong buy signals across all timeframes
Overwhelmingly bearish fundamentals remain with record 1097.8 million ton global supplies yet market holding above 590 suggests worst-case scenarios fully discounted with weather premium supporting
Spec shorts remain elevated near 80,000-90,000 contracts per COT data despite February rally with room for additional covering creating continued asymmetric squeeze potential
Implied volatility elevated at high regime around 32-36% following February rally expansion from compressed levels as market prices in continued two-way risk ahead of March WASDE
Stable agricultural demand environment with USD strength offset by strong US export pace at 875-900 million bushels highest since 2020-21 maintaining competitive positioning
Inverted - short-term volatility significantly elevated above medium-term following February Arctic blast rally and March early dormancy break concerns with two-way action replacing consolidation
Weather-driven rallies from extreme short positioning historically produce 50-80% volatility expansion over 3-4 weeks with violent two-way action - current expansion from 24% to 36% consistent with mid-stages suggesting further expansion likely into March WASDE and weather events
Volatility expanded sharply from January-early February consolidation following Arctic blast and early dormancy break - potential for additional 10-20% expansion if directional move accelerates through March WASDE and freeze events materialize
Daily ranges expanded from compressed 10-16 cents during consolidation to current 20-35 cent action requiring significantly wider stops but offering proportionally higher reward potential - breakout above 600 or breakdown below 575 would trigger accelerated moves given extreme positioning and expanding volatility environment
Elevated volatility creates asymmetric opportunity where March WASDE confirming Arctic blast winterkill damage and March-April freeze risk from early dormancy break combined with continued short-covering from 80,000-90,000 contract positioning could drive explosive 10-15% additional rally toward 620-650 range while downside appears limited to 560-575 retest by March seasonal tailwinds and weather premium support - volatility expansion strongly favors directional momentum strategies over mean reversion
|
⚠️ Primary Risk
March WASDE confirms Arctic blast and early dormancy break winterkill fears overblown sending market back toward 560-575 support as fundamental oversupply narrative reasserts dominance Probability: MEDIUM
|
✦ Primary Opportunity
Sustained rally above 600 toward 620-650 range as March seasonal strength combines with March-April freeze risk from early dormancy break WASDE production downgrade surprises and continued short-covering from elevated positioning Timeframe: Next 2-4 weeks through March 10 WASDE and peak March-April weather risk period
|
ZW wheat futures stand at one of the most extraordinary inflection points in modern agricultural market history on March 1, 2026, trading at $5.915/bushel after staging a spectacular 20% rally from the catastrophic October 2025 breakdown to 52-week lows at $4.9225. This represents a complete reversal of what may be the most significant failure of seasonal patterns ever documented, where November-December 2025 saw record 1,097.8 million ton global oversupply completely overwhelm multi-decade calendar effects for two consecutive months.
The defining catalyst that finally broke six months of bearish stranglehold: mid-February Arctic blast swept through North American Plains with temperatures plunging to -30°F in Kansas and Oklahoma triggering widespread winterkill fears for 2026 winter wheat crop, driving prices up 16% from early February through late February to 573.5. Current price of 591.5 represents continued momentum into March, extending the rally to 20% from October lows. Critical new development as of late February: unusually warm weather prompted winter wheat to break dormancy earlier than usual in late February, creating scenario where if arctic air returns in March or April—increasingly common in volatile climate patterns—severe freeze damage could occur to crops that have already begun active growth.
Late February rains temporarily eased immediate drought stress yet warm temperatures breaking dormancy early raise March-April freeze risk creating weather premium into March 10 WASDE. Positioning dynamics remain explosive: spec shorts near 80,000-90,000 contracts despite February rally still creating fuel for additional covering. March historically represents continuation of late-winter seasonal strength that failed in 2025, and market now tests whether weather catalyst combined with extreme positioning and seasonal tailwinds can establish sustained reversal.
Fundamental backdrop remains dominated by structural oversupply with global stocks at 276+ million tons yet market holding above 590 suggests worst-case scenarios fully discounted. The March 10 WASDE emerges as critical catalyst determining whether Arctic blast winterkill damage and early dormancy break risks are material enough to alter US winter wheat production forecasts or whether this represents weather scare within larger bear market. Current price sits near 52-week high at 596.90 testing all-time resistance with daily trading range 573-597 showing elevated volatility.
Year-over-year up 6.43% marking complete reversal from October despair. Trading context suggests continued volatility expansion with 20-30 cent daily ranges versus compressed 8-12 cent consolidation of late 2025. The combination of 20% rally from capitulation, weather-driven supply concerns, early dormancy break creating March-April freeze vulnerability, elevated short positioning, March seasonal tailwinds, and strong US export floor at 875-900 million bushels creates asymmetric setup where March WASDE confirming production risks could drive explosive additional 5-10% rally toward 620-650 range while downside appears increasingly limited to 560-575 by weather premium and export fundamentals.
Devil's advocate: this rally may represent nothing more than weather scare within structural bear market with fundamentals reasserting dominance once damage assessments reveal limited impact and warm weather continues allowing crop recovery.
| Week | Bias | Confidence | Result |
|---|---|---|---|
| February 27, 2026 | BULLISH | 8/10 | ✅ |
| February 21, 2026 | NO CALL | 7/10 | ➖ |
| February 13, 2026 | NO CALL | 7/10 | ➖ |
| February 8, 2026 | NO CALL | 7/10 | ➖ |
| February 1, 2026 | NO CALL | 7/10 | ➖ |
| January 25, 2026 | NO CALL | 7/10 | ➖ |
| January 11, 2026 | NO CALL | 7/10 | ➖ |
| January 4, 2026 | BEARISH | 7/10 | ❌ |
| December 28, 2025 | BEARISH | 7/10 | ✅ |
| December 21, 2025 | BEARISH | 8/10 | ❌ |
| December 14, 2025 | NO CALL | 7/10 | ➖ |
| December 7, 2025 | NO CALL | 7/10 | ➖ |
📋 PROMPT-READY CONTEXT
Copy this entire block into any AI chat for follow-up analysis
▼ Expand
MACRO AGENT DESK — WEEKLY INTELLIGENCE BRIEFING
═════════════════════════════════════════════════
Asset: Wheat (ZW)
Report Date: March 1, 2026

── DIRECTIONAL BIAS ─────────────────────────────
Call: BULLISH
Confidence: 8/10
Signal: VIEW MAINTAINED FROM LAST WEEK
MAD Index: 72 (HIGH DIVERGENCE)

── MARKET CONTEXT ───────────────────────────────
State: TRENDING UP
Regime: TRENDING UP FROM BREAKDOWN REVERSAL
Sentiment: NEUTRAL

── WHAT THE MARKET SEES ─────────────────────────
Cautiously bullish on February-March rally from extreme October oversold levels with Arctic blast and early dormancy break providing genuine supply catalyst yet skeptical about sustainability above 600 given structural oversupply fundamentals

── WHAT THE MARKET IS MISSING ───────────────────
Market may be underestimating severity and duration of March-April freeze risk from unusually early dormancy break in late February combined with elevated short positioning near 80,000-90,000 contracts creating explosive squeeze potential versus consensus viewing rally as temporary weather scare that will fade once March WASDE confirms limited damage

── KEY DRIVERS ──────────────────────────────────
1. Explosive rally continuation from February Arctic blast winterkill fears with price extending 20% from October 2025 capitulation lows near 492 as late-February moisture concerns and geopolitical risk premium re-emerge
2. Spec short positioning remains elevated near 80,000-90,000 contracts creating continued asymmetric fuel for squeeze dynamics as March typically strong seasonal period maintains momentum
3. Late-February rain in Plains temporarily eased immediate drought stress yet warm weather breaking winter wheat dormancy early raises March-April freeze risk creating weather premium into March 10 WASDE

── KEY ZONES ────────────────────────────────────
Resistance 2: 617.00 – 627.00
Resistance 1: 595.00 – 605.00
Pivot: ~591.50
Support 1: 570.00 – 580.00
Support 2: 555.00 – 565.00

── DISCIPLINE BIASES ────────────────────────────
Technical: BULLISH
Fundamental: BEARISH
Institutional: BULLISH
Options: BULLISH
Economic: NO CALL
Sentiment: BULLISH

── TECHNICAL STRUCTURE ──────────────────────────
Strong 20% rally from October 492 lows to 591.5 breaking above all major resistance with momentum sustained and technical indicators showing strong buy signals across all timeframes

── FUNDAMENTAL ASSESSMENT ───────────────────────
Overwhelmingly bearish fundamentals remain with record 1097.8 million ton global supplies yet market holding above 590 suggests worst-case scenarios fully discounted with weather premium supporting

── INSTITUTIONAL POSITIONING ────────────────────
Spec shorts remain elevated near 80,000-90,000 contracts per COT data despite February rally with room for additional covering creating continued asymmetric squeeze potential

── OPTIONS FLOW ─────────────────────────────────
Implied volatility elevated at high regime around 32-36% following February rally expansion from compressed levels as market prices in continued two-way risk ahead of March WASDE

── ECONOMIC BACKDROP ────────────────────────────
Stable agricultural demand environment with USD strength offset by strong US export pace at 875-900 million bushels highest since 2020-21 maintaining competitive positioning

── VOLATILITY REGIME ────────────────────────────
Regime: HIGH
Percentile: 82nd
Trend: Expanding ▲
Days in Regime: 14
Term Structure: inverted - short-term volatility significantly elevated above medium-term following February Arctic blast rally and March early dormancy break concerns with two-way action replacing consolidation
Historical Pattern: Weather-driven rallies from extreme short positioning historically produce 50-80% volatility expansion over 3-4 weeks with violent two-way action - current expansion from 24% to 36% consistent with mid-stages suggesting further expansion likely into March WASDE and weather events
Outlook: Volatility expanded sharply from January-early February consolidation following Arctic blast and early dormancy break - potential for additional 10-20% expansion if directional move accelerates through March WASDE and freeze events materialize
Trading Context: Daily ranges expanded from compressed 10-16 cents during consolidation to current 20-35 cent action requiring significantly wider stops but offering proportionally higher reward potential - breakout above 600 or breakdown below 575 would trigger accelerated moves given extreme positioning and expanding volatility environment
Vol Risk/Opportunity: Elevated volatility creates asymmetric opportunity where March WASDE confirming Arctic blast winterkill damage and March-April freeze risk from early dormancy break combined with continued short-covering from 80,000-90,000 contract positioning could drive explosive 10-15% additional rally toward 620-650 range while downside appears limited to 560-575 retest by March seasonal tailwinds and weather premium support - volatility expansion strongly favors directional momentum strategies over mean reversion

── PRIMARY RISK ─────────────────────────────────
March WASDE confirms Arctic blast and early dormancy break winterkill fears overblown sending market back toward 560-575 support as fundamental oversupply narrative reasserts dominance
Probability: MEDIUM

── PRIMARY OPPORTUNITY ──────────────────────────
Sustained rally above 600 toward 620-650 range as March seasonal strength combines with March-April freeze risk from early dormancy break WASDE production downgrade surprises and continued short-covering from elevated positioning
Timeframe: Next 2-4 weeks through March 10 WASDE and peak March-April weather risk period

── NEXT CATALYST ────────────────────────────────
Date: March 10, 2026
Event: USDA March 2026 WASDE Report with winter wheat acreage estimates and condition assessments following Arctic blast and early dormancy break
Expected Impact: HIGH

── FULL ANALYSIS ────────────────────────────────
ZW wheat futures stand at one of the most extraordinary inflection points in modern agricultural market history on March 1, 2026, trading at $5.915/bushel after staging a spectacular 20% rally from the catastrophic October 2025 breakdown to 52-week lows at $4.9225. This represents a complete reversal of what may be the most significant failure of seasonal patterns ever documented, where November-December 2025 saw record 1,097.8 million ton global oversupply completely overwhelm multi-decade calendar effects for two consecutive months. The defining catalyst that finally broke six months of bearish stranglehold: mid-February Arctic blast swept through North American Plains with temperatures plunging to -30°F in Kansas and Oklahoma triggering widespread winterkill fears for 2026 winter wheat crop, driving prices up 16% from early February through late February to 573.5. Current price of 591.5 represents continued momentum into March, extending the rally to 20% from October lows. Critical new development as of late February: unusually warm weather prompted winter wheat to break dormancy earlier than usual in late February, creating scenario where if arctic air returns in March or April—increasingly common in volatile climate patterns—severe freeze damage could occur to crops that have already begun active growth. Late February rains temporarily eased immediate drought stress yet warm temperatures breaking dormancy early raise March-April freeze risk creating weather premium into March 10 WASDE. Positioning dynamics remain explosive: spec shorts near 80,000-90,000 contracts despite February rally still creating fuel for additional covering. March historically represents continuation of late-winter seasonal strength that failed in 2025, and market now tests whether weather catalyst combined with extreme positioning and seasonal tailwinds can establish sustained reversal. Fundamental backdrop remains dominated by structural oversupply with global stocks at 276+ million tons yet market holding above 590 suggests worst-case scenarios fully discounted. The March 10 WASDE emerges as critical catalyst determining whether Arctic blast winterkill damage and early dormancy break risks are material enough to alter US winter wheat production forecasts or whether this represents weather scare within larger bear market. Current price sits near 52-week high at 596.90 testing all-time resistance with daily trading range 573-597 showing elevated volatility. Year-over-year up 6.43% marking complete reversal from October despair. Trading context suggests continued volatility expansion with 20-30 cent daily ranges versus compressed 8-12 cent consolidation of late 2025. The combination of 20% rally from capitulation, weather-driven supply concerns, early dormancy break creating March-April freeze vulnerability, elevated short positioning, March seasonal tailwinds, and strong US export floor at 875-900 million bushels creates asymmetric setup where March WASDE confirming production risks could drive explosive additional 5-10% rally toward 620-650 range while downside appears increasingly limited to 560-575 by weather premium and export fundamentals. Devil's advocate: this rally may represent nothing more than weather scare within structural bear market with fundamentals reasserting dominance once damage assessments reveal limited impact and warm weather continues allowing crop recovery.

═════════════════════════════════════════════════
Source: Macro Agent Desk (macroagentdesk.com)


