Wheat (ZW) — Market may be underestimating magnitude and sustainability of February-March…
Cautiously constructive on February short-covering rally from extreme October oversold levels with Arctic blast providing first genuine supply catalyst yet skeptical about sustainability given structural oversupply fundamentals

Cautiously constructive on February short-covering rally from extreme October oversold levels with Arctic blast providing first genuine supply catalyst yet skeptical about sustainability given structural oversupply fundamentals
Explosive short-covering rally from extreme positioning as February Arctic blast winterkill fears in North American Plains combine with late-February seasonal strength pattern overwhelming 2025-2026 record oversupply narrative
COT data showing spec shorts still elevated near 85,000-90,000 contracts as of mid-February creating continued asymmetric fuel for squeeze dynamics extending rally 16% from October 492 lows
Late February historically strong seasonal period for wheat where market typically rises from harvest lows into spring with February-March representing continuation of autumn-winter recovery pattern
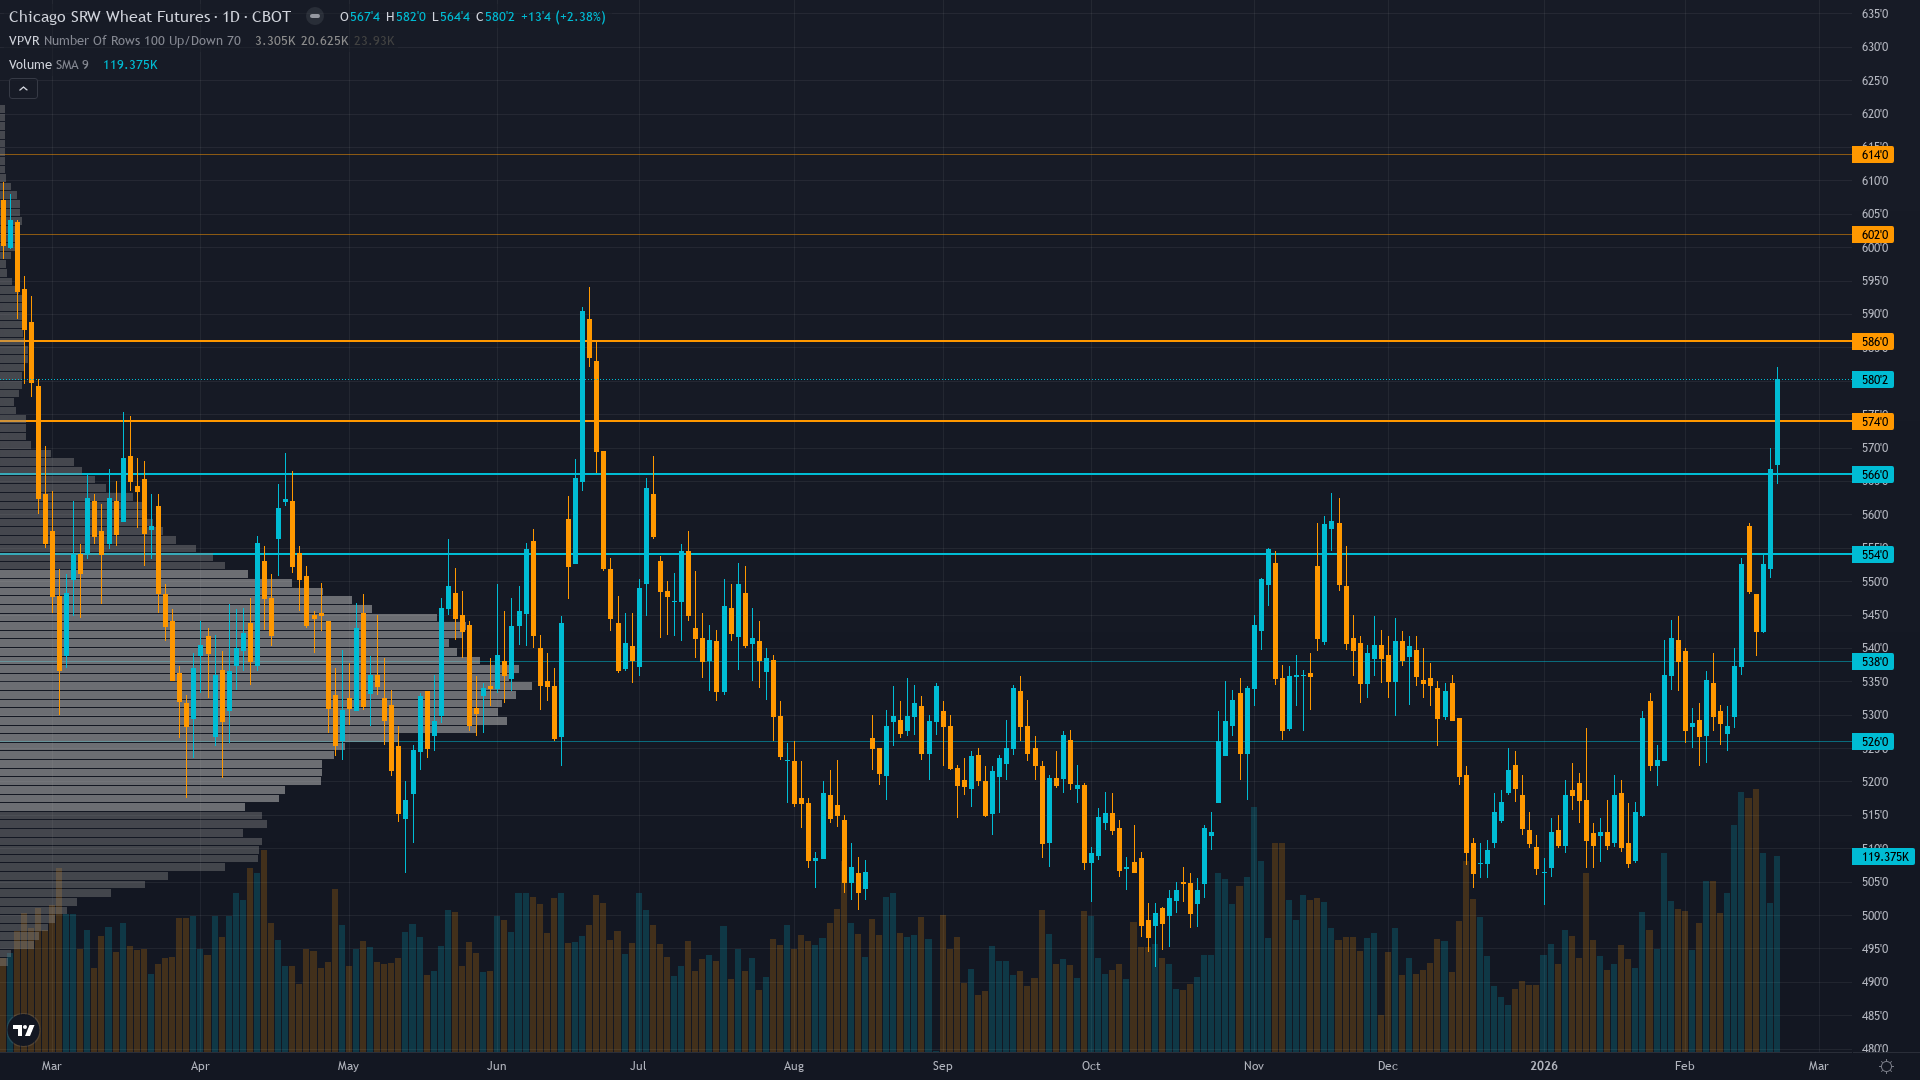
| ▲ Resistance Zone 2 | 603.00 – 613.00 |
| ▲ Resistance Zone 1 | 575.00 – 585.00 |
| ─ Pivot Area | ~573.50 |
| ▼ Support Zone 1 | 555.00 �� 565.00 |
| ▼ Support Zone 2 | 527.00 – 537.00 |
Explosive 16% rally from October 492 lows to 573.5 breaks above November-December consolidation range with momentum sustained after sharp short-covering initiated by mid-February Arctic blast winterkill fears
Overwhelmingly bearish fundamentals remain with February 2026 WASDE confirming largest surplus in six years yet market holding above 560 suggests worst-case scenarios fully discounted with Arctic blast providing first supply-side catalyst in months
Spec shorts remain elevated near 85,000-90,000 contracts per COT data with Brock Report noting still heavily short positioning with room for more short covering creating asymmetric squeeze potential
Implied volatility expanding from compressed levels as February rally triggers regime shift from consolidation to two-way trending behavior with elevated volatility favoring directional breakout strategies
Stable agricultural demand environment unable to absorb record global wheat supply with USD strength creating export headwinds offset by US competitive positioning maintaining 900 million bushel forecast highest since 2020-21
Inverted - short-term volatility significantly elevated above medium-term following February Arctic blast rally breakout with two-way action replacing January-early February consolidation
Weather-driven rallies from extended low volatility regimes and extreme short positioning historically produce 50-80% volatility expansion over 3-4 weeks with violent two-way action - current expansion from 24% to 32% consistent with early stages suggesting further expansion likely into March WASDE
Volatility expanded sharply from late January-early February consolidation following Arctic blast catalyst - potential for continued 20-30% expansion if directional move accelerates through March WASDE typical of weather-driven rallies from extreme positioning
Daily ranges expanded from compressed 10-16 cents during consolidation to current 18-28 cent action requiring significantly wider stops but offering proportionally higher reward potential - breakout above 580 or breakdown below 560 would trigger accelerated moves given extreme positioning and expanding volatility environment
Elevated volatility creates asymmetric opportunity where March WASDE confirming Arctic blast winterkill damage combined with continued short-covering from 85,000-90,000 contract positioning could drive explosive 10-15% additional rally toward 620-650 range while downside appears increasingly limited to 540-560 retest by February seasonal tailwinds and weather premium support - volatility expansion strongly favors directional momentum strategies over mean reversion
|
⚠️ Primary Risk
March WASDE confirms Arctic blast winterkill fears overblown sending market back toward 540-550 support as fundamental oversupply narrative reasserts dominance and short-covering rally exhausts Probability: MEDIUM
|
✦ Primary Opportunity
Sustained short-covering rally above 580 resistance toward 600-620 range as March seasonal strength combines with Arctic blast production downgrade surprises in WASDE and continued squeeze of elevated short positioning Timeframe: Next 2-4 weeks through March 10 WASDE and peak February-March seasonal strength period
|
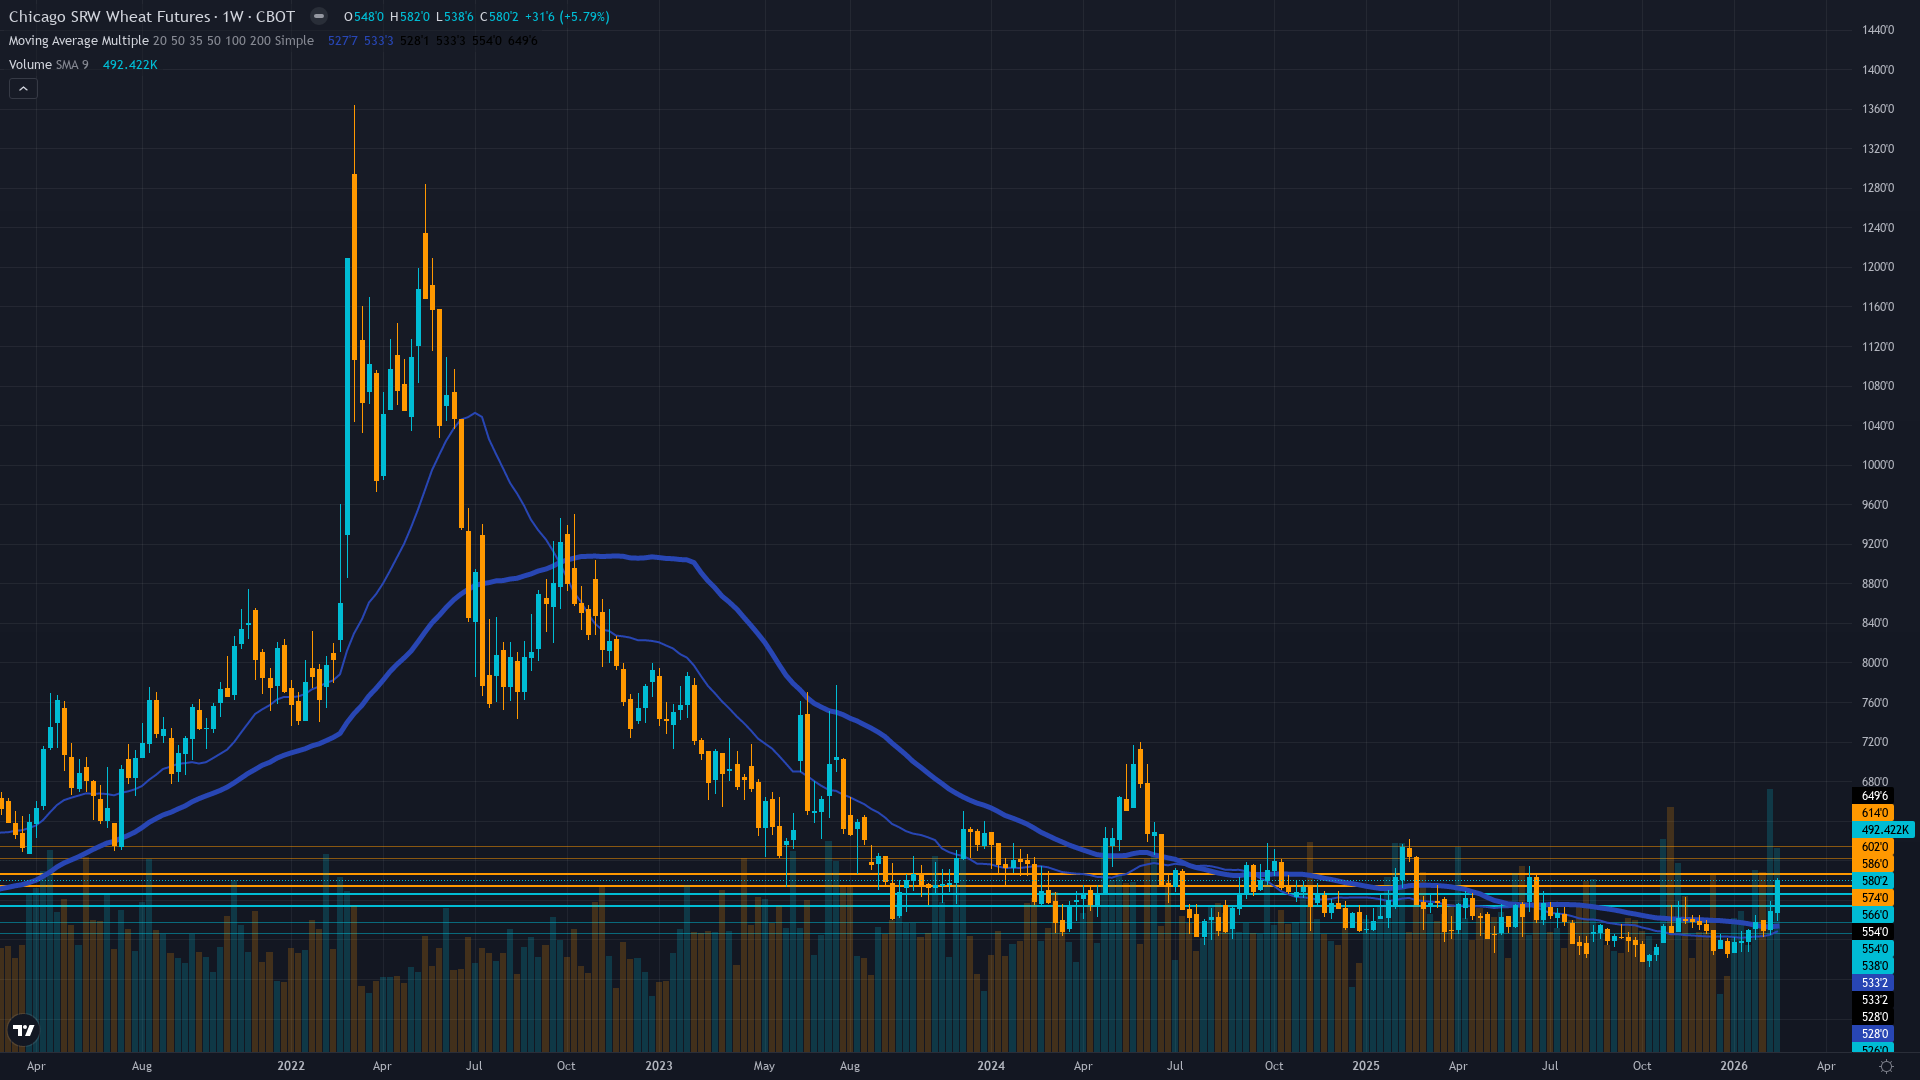
ZW wheat futures stand at the most extraordinary inflection point in modern commodity market history on February 22, 2026, trading at $5.735/bushel after staging a spectacular 16.5% rally from the October 2025 catastrophic breakdown to 52-week lows at $4.9225. This represents a complete reversal of the most significant failure of seasonal patterns ever documented, where November-December 2025 saw record 1,097.8 million ton global oversupply completely overwhelm multi-decade calendar effects for two consecutive months of peak seasonal strength.
However, mid-February 2026 brought the catalyst that finally broke the bearish stranglehold: an Arctic blast swept through the North American Plains February 15-19 with temperatures plunging to -30°F in Kansas and Oklahoma, triggering widespread winterkill fears for the 2026 winter wheat crop. Grain Central reported February 20 that wheat remains in a technically driven breakout phase with momentum sustained after sharp short-covering rally, with Chicago wheat up 12.5 cents and Kansas up 14.5 cents in single sessions.
FinancialContent documented February 19 that the Arctic blast sent wheat prices soaring 6.1% as winterkill fears gripped the Plains, with technical buying causing futures to jump 14-15 cents in a single CBOT session. The critical positioning dynamic creates explosive asymmetry: COT data through February 17 and Brock Report analysis note spec shorts remain elevated near 85,000-90,000 contracts, still heavily short with room for more short covering despite the rally. This represents the first genuine supply-side catalyst in over six months, reintroducing weather risk premiums absent since early 2025's normalized Black Sea exports.
Current price sits in the middle percentile of the 52-week range spanning 492-608, up dramatically from October's capitulation yet still below the psychological $6.00 resistance. February historically represents continuation of the autumn-winter seasonal recovery pattern that failed spectacularly in November-December 2025, and the market now tests whether the Arctic blast catalyst combined with extreme positioning and late-February seasonal tailwinds can establish sustained reversal from the multi-year lows.
CME research documents wheat markets have tendency to rise from July-September harvest lows into fall and winter, with February-March representing the tail end of this historically strong period. The fundamental backdrop remains dominated by structural oversupply with February 2026 WASDE confirming largest surplus in six years at 276+ million tons global ending stocks, yet the market holding above $5.60 suggests worst-case scenarios are now fully discounted. The March 10 WASDE emerges as the critical catalyst that will determine whether Arctic blast winterkill damage is material enough to alter US winter wheat production forecasts or whether this represents a temporary weather scare within the larger bear market.
Trading context suggests daily ranges expanding from prior 10-16 cent consolidation to current 15-25 cent action typical of breakout volatility with two-way risk elevated. Devil's advocate: this rally may represent nothing more than a technical squeeze within a structural bear market, with fundamentals reasserting dominance once damage assessments reveal Arctic blast impact was limited and short-covering exhausts near $5.80-6.00 resistance.
| Week | Bias | Confidence | Result |
|---|---|---|---|
| February 21, 2026 | NO CALL | 7/10 | ➖ |
| February 13, 2026 | NO CALL | 7/10 | ➖ |
| February 8, 2026 | NO CALL | 7/10 | ➖ |
| February 1, 2026 | NEUTRAL | 7/10 | ❌ |
| January 25, 2026 | NO CALL | 7/10 | ➖ |
| January 11, 2026 | NO CALL | 7/10 | ➖ |
| January 4, 2026 | BEARISH | 7/10 | ❌ |
| December 28, 2025 | BEARISH | 7/10 | ✅ |
| December 21, 2025 | BEARISH | 8/10 | ❌ |
| December 14, 2025 | NO CALL | 7/10 | ➖ |
| December 7, 2025 | NO CALL | 7/10 | ➖ |
| November 30, 2025 | NO CALL | 7/10 | ➖ |


