Wheat (ZW) — February historically strongest seasonal period for wheat testing whether…
Bearish consensus has complete dominance expecting continued weakness yet acknowledging potential for tactical bounces from extreme positioning and emerging Black Sea weather concerns with February seasonal patterns historically strong but completely ignored after 2025 failure

Bearish consensus has complete dominance expecting continued weakness yet acknowledging potential for tactical bounces from extreme positioning and emerging Black Sea weather concerns with February seasonal patterns historically strong but completely ignored after 2025 failure
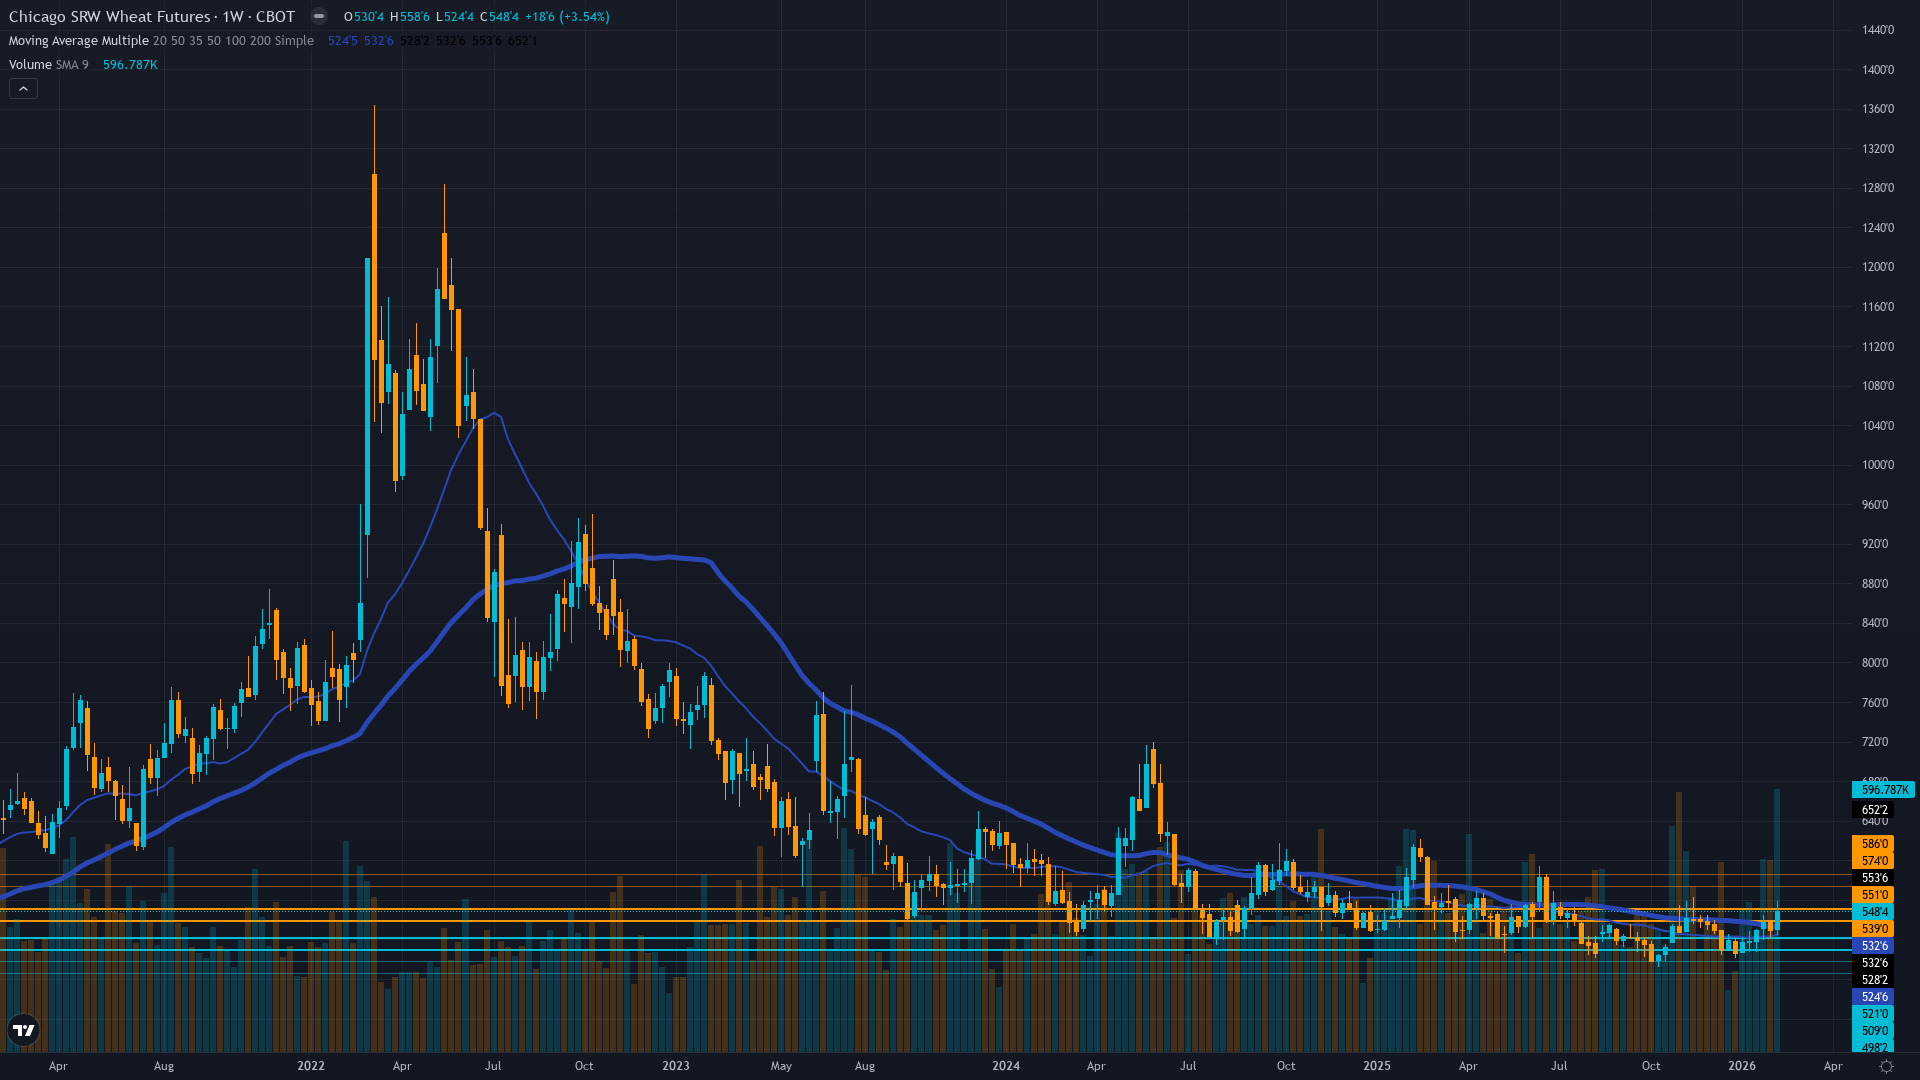
February historically strongest seasonal period for wheat testing whether calendar strength can finally assert itself after catastrophic November-December 2025 failure where record 1097.8 million ton global oversupply overwhelmed multi-decade patterns
Black Sea winter weather concerns emerged late January-early February 2026 with extreme cold and frozen ports threatening Russian-Ukrainian winter wheat reintroducing first supply-side risk premium in six months
Extreme oversold positioning with market trading just 8% above October 2025 capitulation lows at 492.25 following most spectacular failure of seasonal patterns in commodity market history
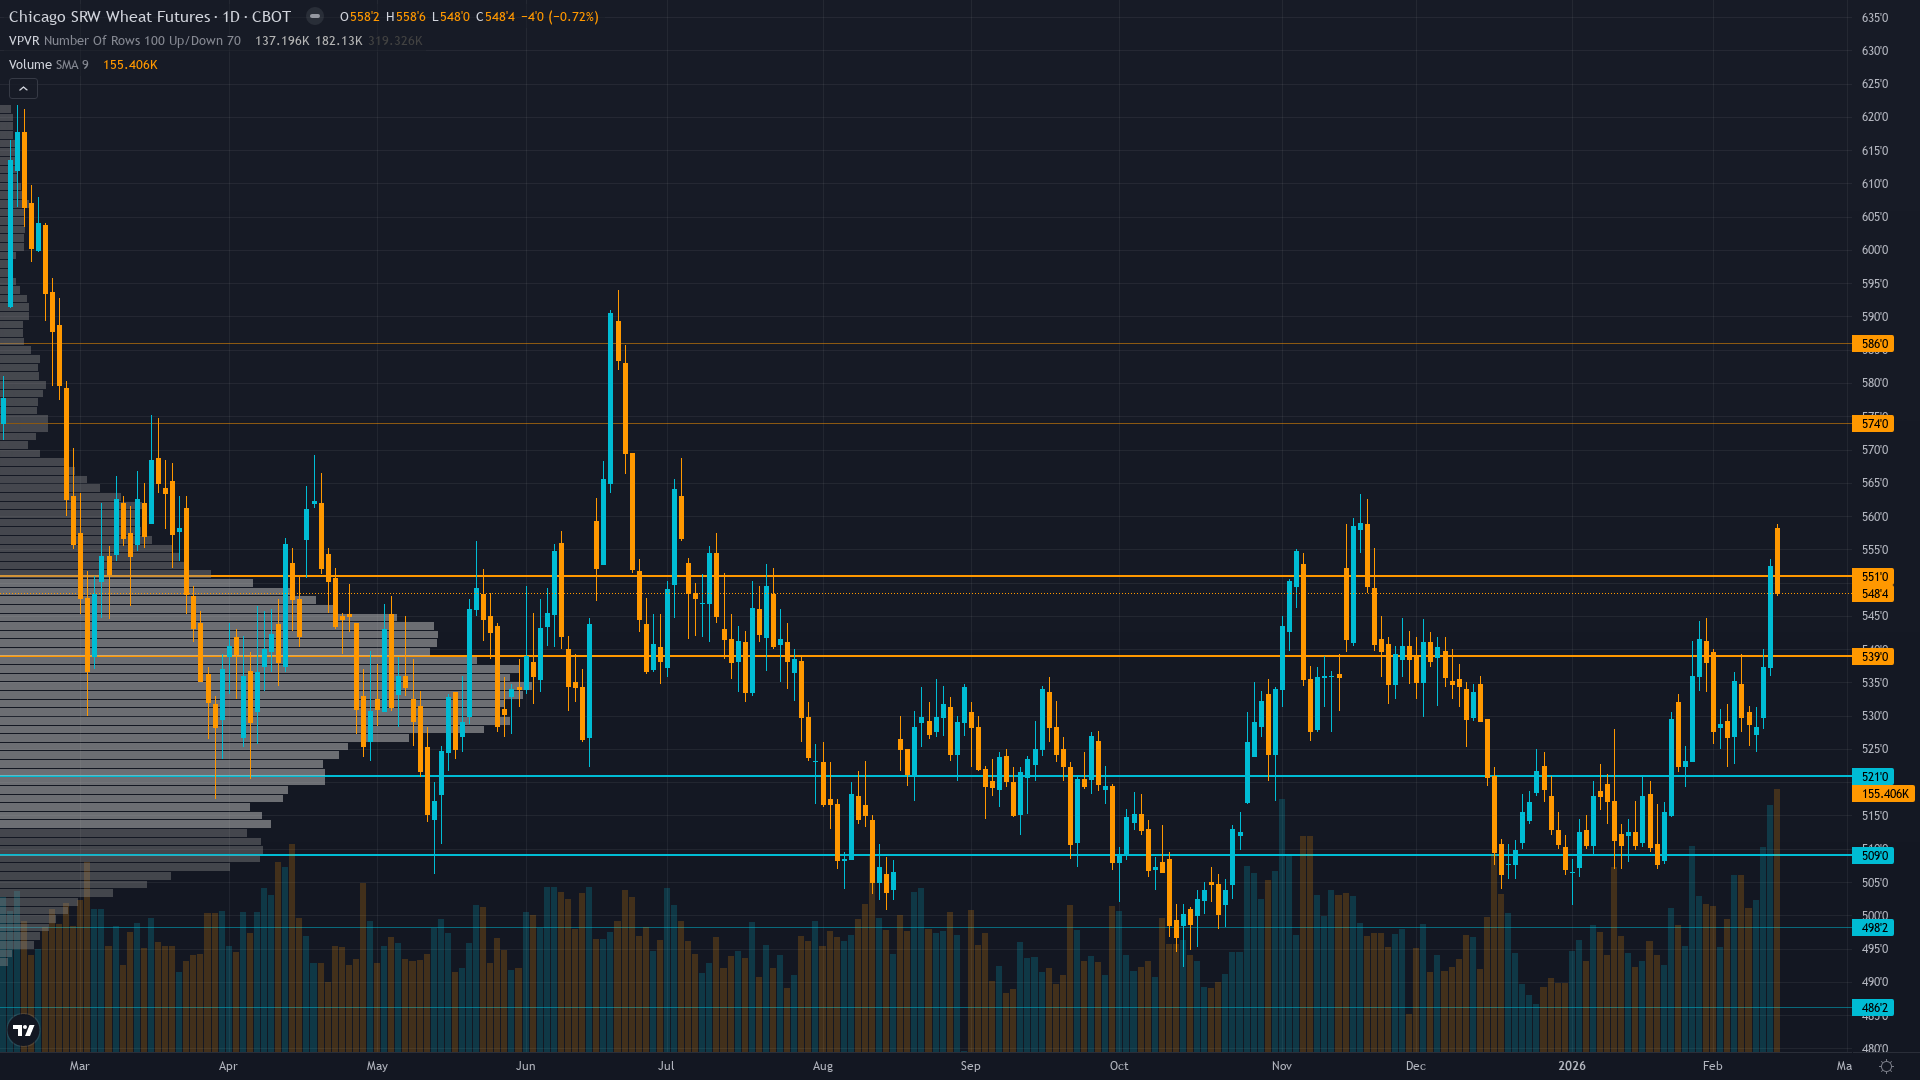
| ▲ Resistance Zone 2 | 575.00 – 585.00 |
| ▲ Resistance Zone 1 | 540.00 – 550.00 |
| ─ Pivot Area | ~530.00 |
| ▼ Support Zone 1 | 510.00 – 520.00 |
| ▼ Support Zone 2 | 487.25 – 497.25 |
Trading at 532.25 just 8.1% above October 2025 catastrophic breakdown floor at 492.25 in lower 30th percentile of 52-week range 492-622 attempting stabilization after complete November-December seasonal pattern failure
Overwhelmingly bearish with February 10 2026 WASDE confirming near-record global stocks yet neutral-to-bearish market reaction suggests worst-case scenarios fully discounted with strong 900 million bushel US export pace providing tangible floor around 515-520
Net short 109,483 contracts as of January 7 2026 representing largest bearish position since October 2025 creating asymmetric short-covering vulnerability at multi-year lows though positioning pared back ahead of February WASDE
Implied volatility normalizing around 24% annualized after October 2025 breakdown expansion reflecting market acceptance of oversupply narrative yet readings remain elevated versus prior 18% compression suggesting continued two-way risk into February
Stable agricultural demand environment unable to absorb record global wheat supply with USD strength creating export headwinds offset by US competitive positioning maintaining 11% global market share at highest forecast since 2020-21
Normalizing - short-term volatility stable around medium-term following October 2025 breakdown and February 2026 stabilization with term structure flattening as market finds equilibrium
Post-breakdown volatility typically remains elevated 10-12 weeks before normalizing - current 18-week period since October 2025 capitulation suggests volatility normalization underway unless fresh Black Sea weather catalyst triggers new expansion phase
Volatility expanded from October 2025 breakdown through December consolidation now stabilizing around normal range suggesting market acceptance of new lower price equilibrium around 515-530 level with potential for spike if Black Sea weather concerns accelerate or breakdown extends below 515
Daily ranges stable around 10-16 cents suggesting reduced directional conviction near multi-year lows - breakout above 545 or breakdown below 515 would trigger expansion with Black Sea weather developments representing high-impact catalyst for potential volatility spike in either direction
Stable volatility near 52-week lows creates asymmetric setup where unexpected bullish catalyst from Black Sea port disruptions severe Russian-Ukrainian winter weather or March WASDE surprises could trigger explosive 10-15% short-covering rally toward 560-580 while downside appears increasingly limited to 492-515 zone by export floor and extreme oversold conditions from October
|
⚠️ Primary Risk
March WASDE confirms continued global oversupply trajectory sending market below 515 support toward retesting October 492 lows as February seasonal strength proven impotent like November-December 2025 Probability: MEDIUM
|
✦ Primary Opportunity
Black Sea winter weather disruptions intensify combined with February-March seasonal tailwinds and extreme short positioning near 109,483 contracts triggering explosive 10-15% short-covering rally toward 580-600 range as first genuine supply catalyst materializes Timeframe: Next 2-6 weeks through March WASDE and peak winter weather assessment period for 2026 Black Sea crop
|
ZW wheat futures stand at one of the most critical inflection points in modern commodity market history on February 15, 2026, trading at 532.25 cents per bushel after experiencing the most spectacular failure of seasonal patterns on record during November-December 2025 where record 1,097.8 million ton global oversupply completely overwhelmed multi-decade calendar effects. The market enters mid-February having surrendered nearly all gains from the November bounce that peaked near 541, yet holding 8% above the October capitulation lows at 492.25 that marked 52-week extremes.
The defining narrative of the past four months has been the complete breakdown of historically reliable seasonal patterns: November and December traditionally represent wheat's strongest period with consistent recoveries from harvest lows documented over decades by CME research, yet 2025 marked the first time in modern history where two consecutive months of peak seasonal strength were completely overwhelmed by fundamental forces as normalized Black Sea exports created a regime shift from scarcity to abundance. However, February 2026 brings the first genuine bullish catalysts in six months: late January and early February extreme cold in the Black Sea region, particularly Ukraine and Southern Russia, are triggering widespread wheat winterkill concerns as severe winter weather threatens dormant winter wheat crops with frozen ports disrupting export flows, reintroducing supply-side risk premiums absent since early 2025.
The February 10 WASDE report delivered neutral-to-slightly-bearish data yet the market held above 530 support suggesting worst-case oversupply scenarios may now be fully discounted at these multi-year lows. Current positioning shows spec shorts at 109,483 contracts as of January 7—the largest bearish position since October 2025—reflecting entrenched oversupply consensus yet creating maximum vulnerability to squeeze dynamics. Trading Economics noted on February 9 that positioning has been pared back ahead of the February WASDE reinforcing downside pressure while competitively priced Black Sea exports continue to cap upside.
The critical question for the next 2-6 weeks: can emerging Black Sea weather concerns combine with February-March seasonal patterns—which CME research shows wheat typically rises from July-September lows into fall and winter—to finally establish genuine reversal from multi-year lows, or does structural oversupply reassert dominance once weather concerns fade? Current price essentially reflects worst-case scenarios fully discounted creating asymmetric setup where unexpected bullish catalysts from intensifying Black Sea winterkill, stronger export demand, or March WASDE production downgrades could trigger explosive 10-15% short-covering rallies toward 560-580 given the 109,483 contract net short position and stable volatility environment, while downside appears increasingly limited by psychological 515 support and strong 900 million bushel export floor providing tangible fundamental support around 515-520 zone.
Volatility has normalized from October breakdown expansion to 52nd percentile suggesting market acceptance of new equilibrium yet readings at 24% remain elevated versus the 62-day low regime compression of August-October 2025 at 18%. The combination of extreme oversold technical conditions at 52-week lows, historically crowded short positioning, emerging Black Sea weather catalyst providing first supply-side risks in months, potential February-March seasonal tailwinds attempting to reassert after spectacular 2025 failure, and the 900 million bushel export floor creates setup where 2026 could mark either extension of generational oversupply bear market or the beginning of mean reversion as weather concerns and positioning dynamics overwhelm fundamental headwinds.
| Week | Bias | Confidence | Result |
|---|---|---|---|
| February 8, 2026 | NO CALL | 7/10 | ➖ |
| February 1, 2026 | NEUTRAL | 7/10 | ❌ |
| January 25, 2026 | NO CALL | 7/10 | ➖ |
| January 11, 2026 | NO CALL | 7/10 | ➖ |
| January 4, 2026 | BEARISH | 7/10 | ❌ |
| December 28, 2025 | BEARISH | 7/10 | ✅ |
| December 21, 2025 | BEARISH | 8/10 | ❌ |
| December 14, 2025 | NO CALL | 7/10 | ➖ |
| December 7, 2025 | NO CALL | 7/10 | ➖ |
| November 30, 2025 | NO CALL | 7/10 | ➖ |
| November 23, 2025 | NO CALL | 7/10 | ➖ |


