Soybeans (ZS) — Market may be underestimating resilience of renewable diesel structural demand…
Cautiously bearish on China trade uncertainty and South American harvest pressure overwhelming tight US supply fundamentals with seasonal weakness creating range-bound consolidation

Cautiously bearish on China trade uncertainty and South American harvest pressure overwhelming tight US supply fundamentals with seasonal weakness creating range-bound consolidation
China trade uncertainty after March 16 limit-down selloff triggered by potential Trump-Xi meeting postponement undermining 20 MMT upgrade expectations with prices down 5% from March 12 highs
March 12 WASDE showed minimal changes with US supplies raised 5M bushels and Brazilian soybeans trading $0.80-$1.00 below US creating persistent export competitiveness headwinds
Record US domestic crush demand at 2.56-2.795B bushels from renewable diesel mandates providing critical structural floor offsetting China uncertainty
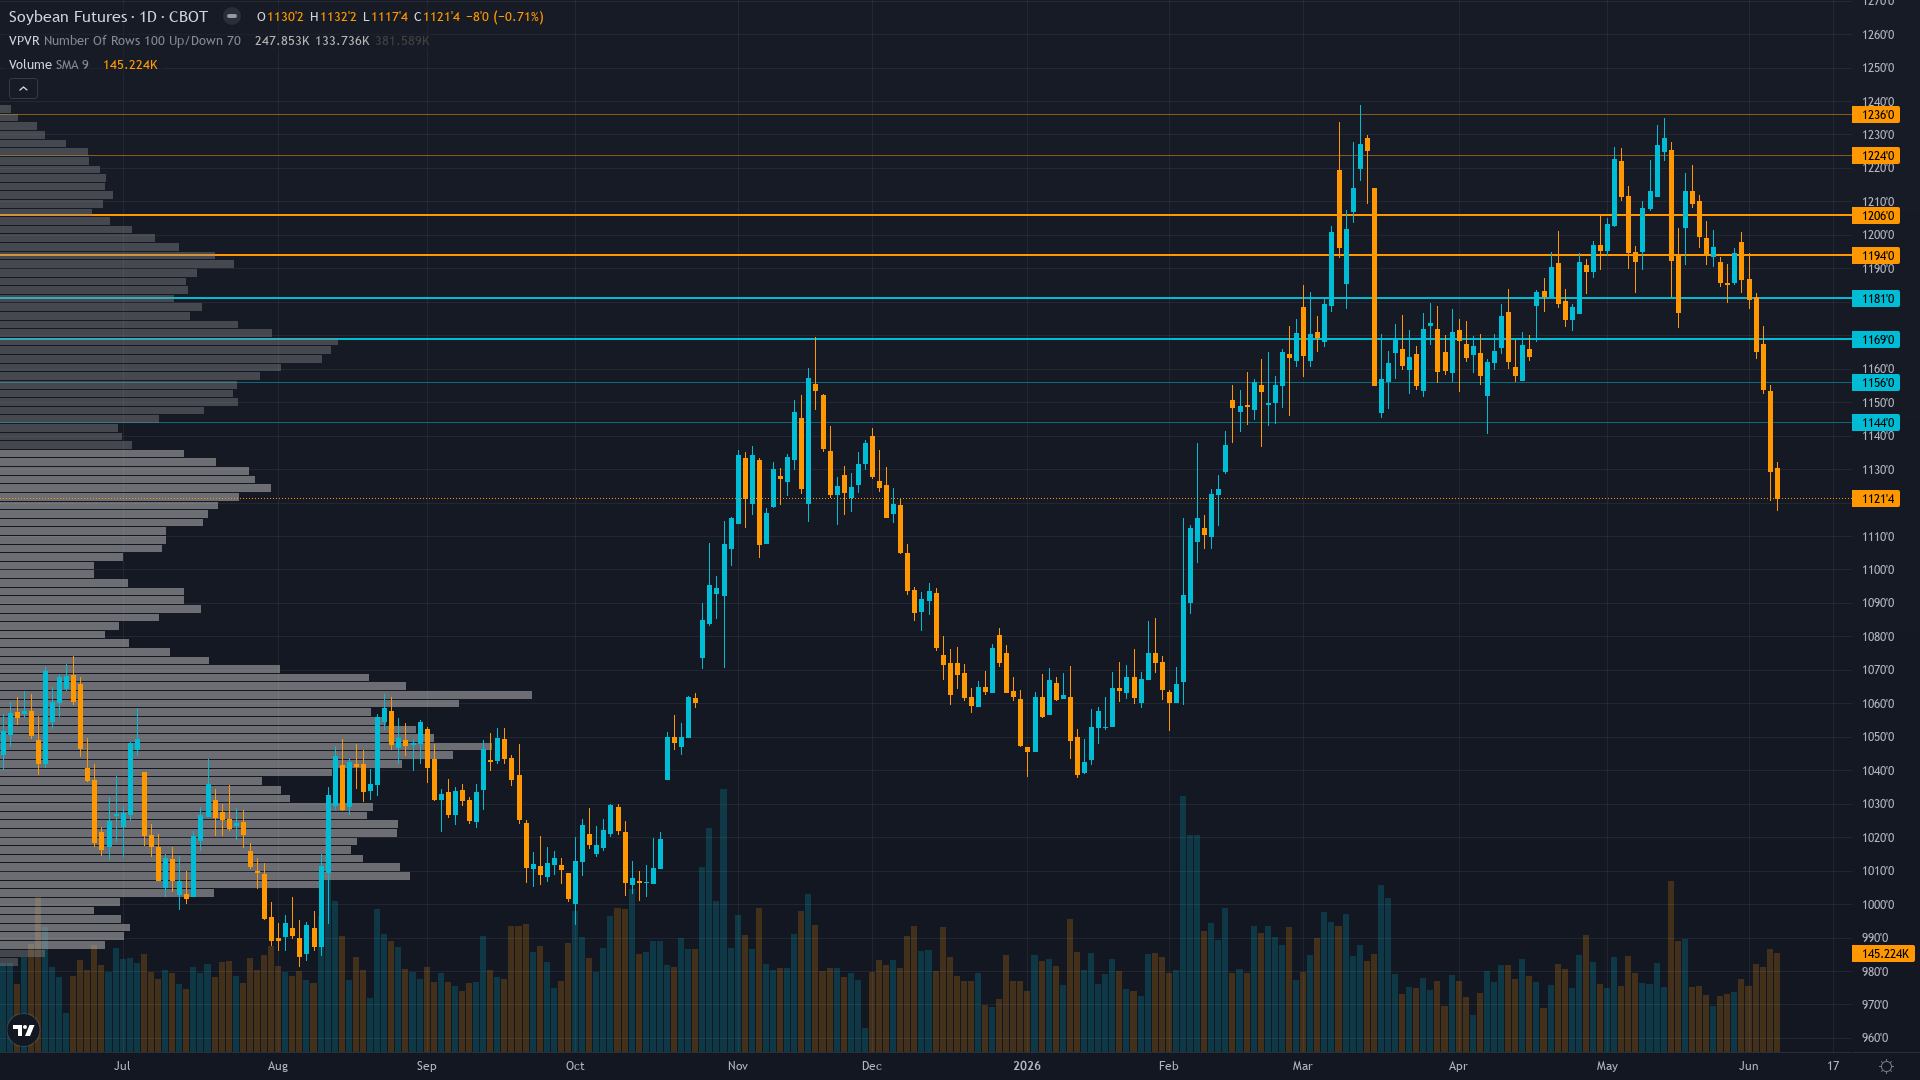
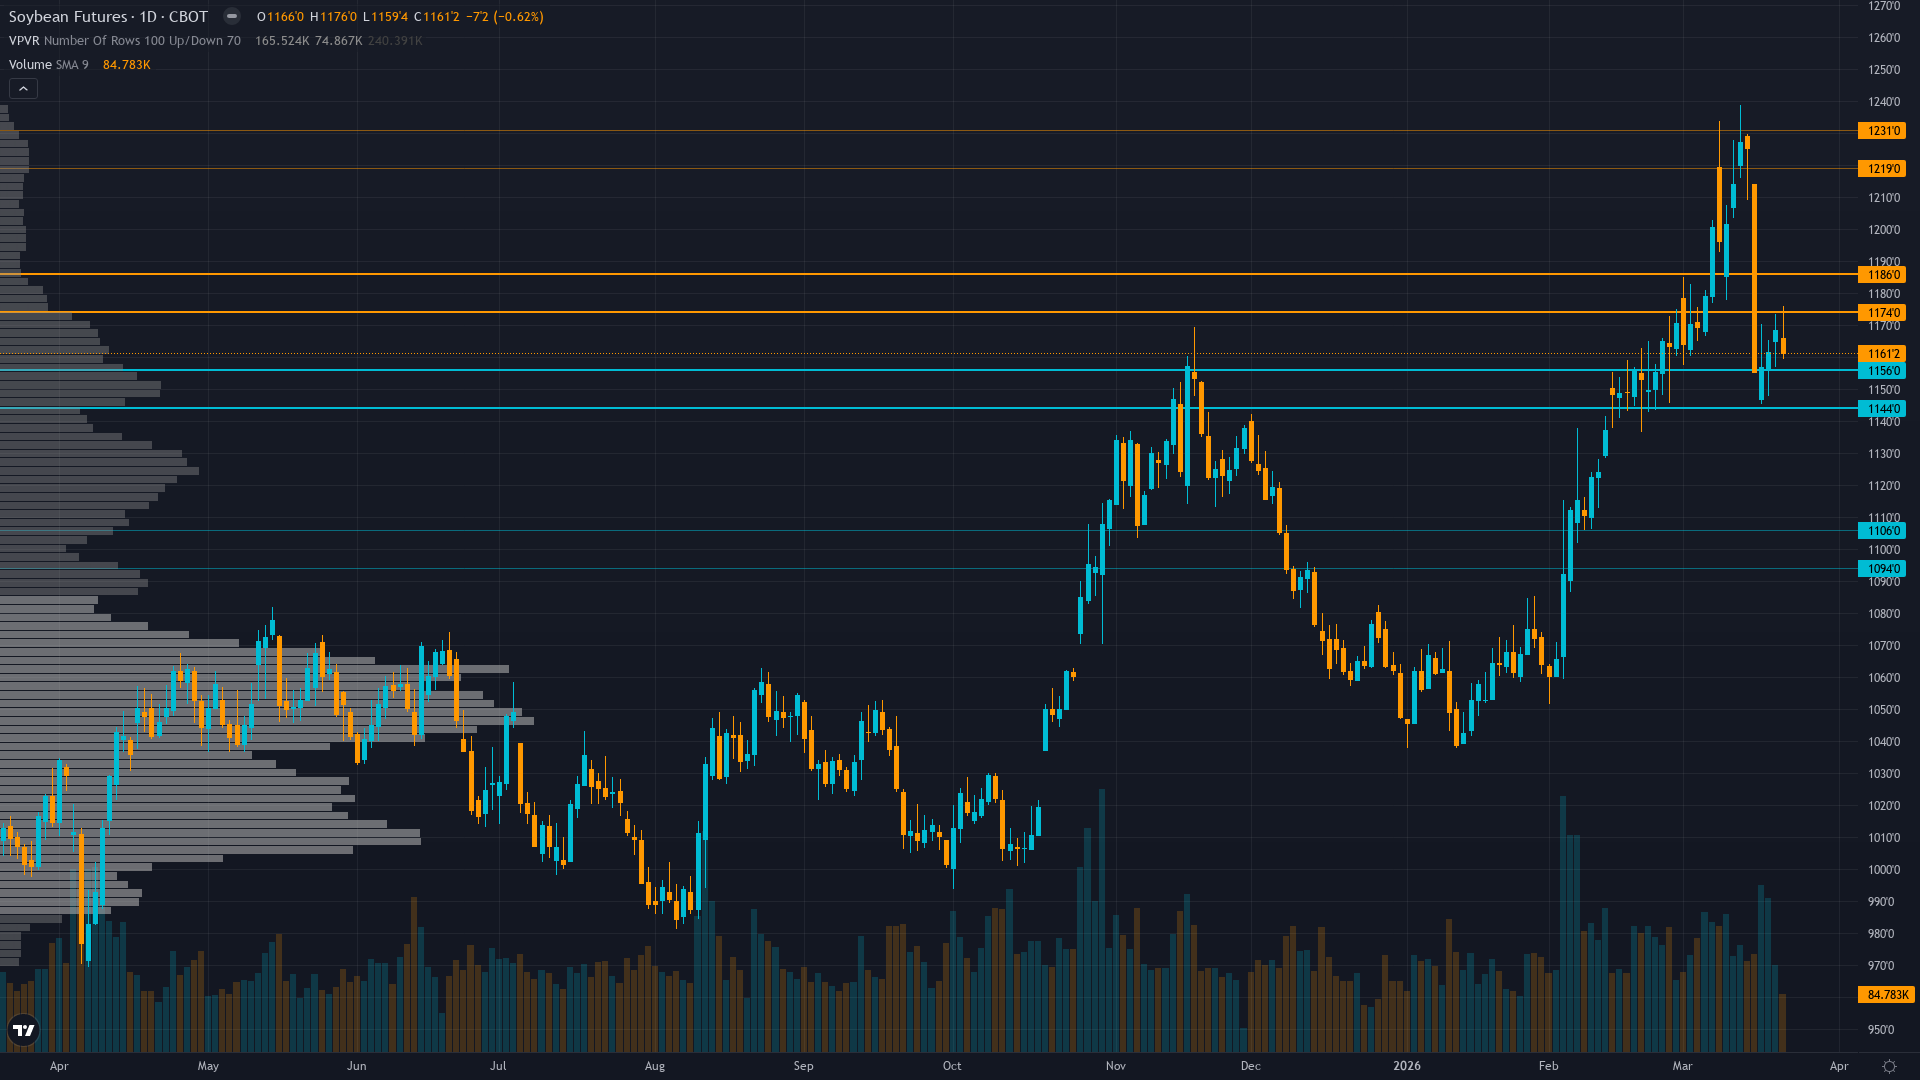
| ▼ Resistance Zone 2 | 1220.00 – 1230.00 |
| ▼ Resistance Zone 1 | 1175.00 – 1185.00 |
| ─ Pivot Area | ~1168.50 |
| ▲ Support Zone 1 | 1145.00 – 1155.00 |
| ▲ Support Zone 2 | 1095.00 – 1105.00 |
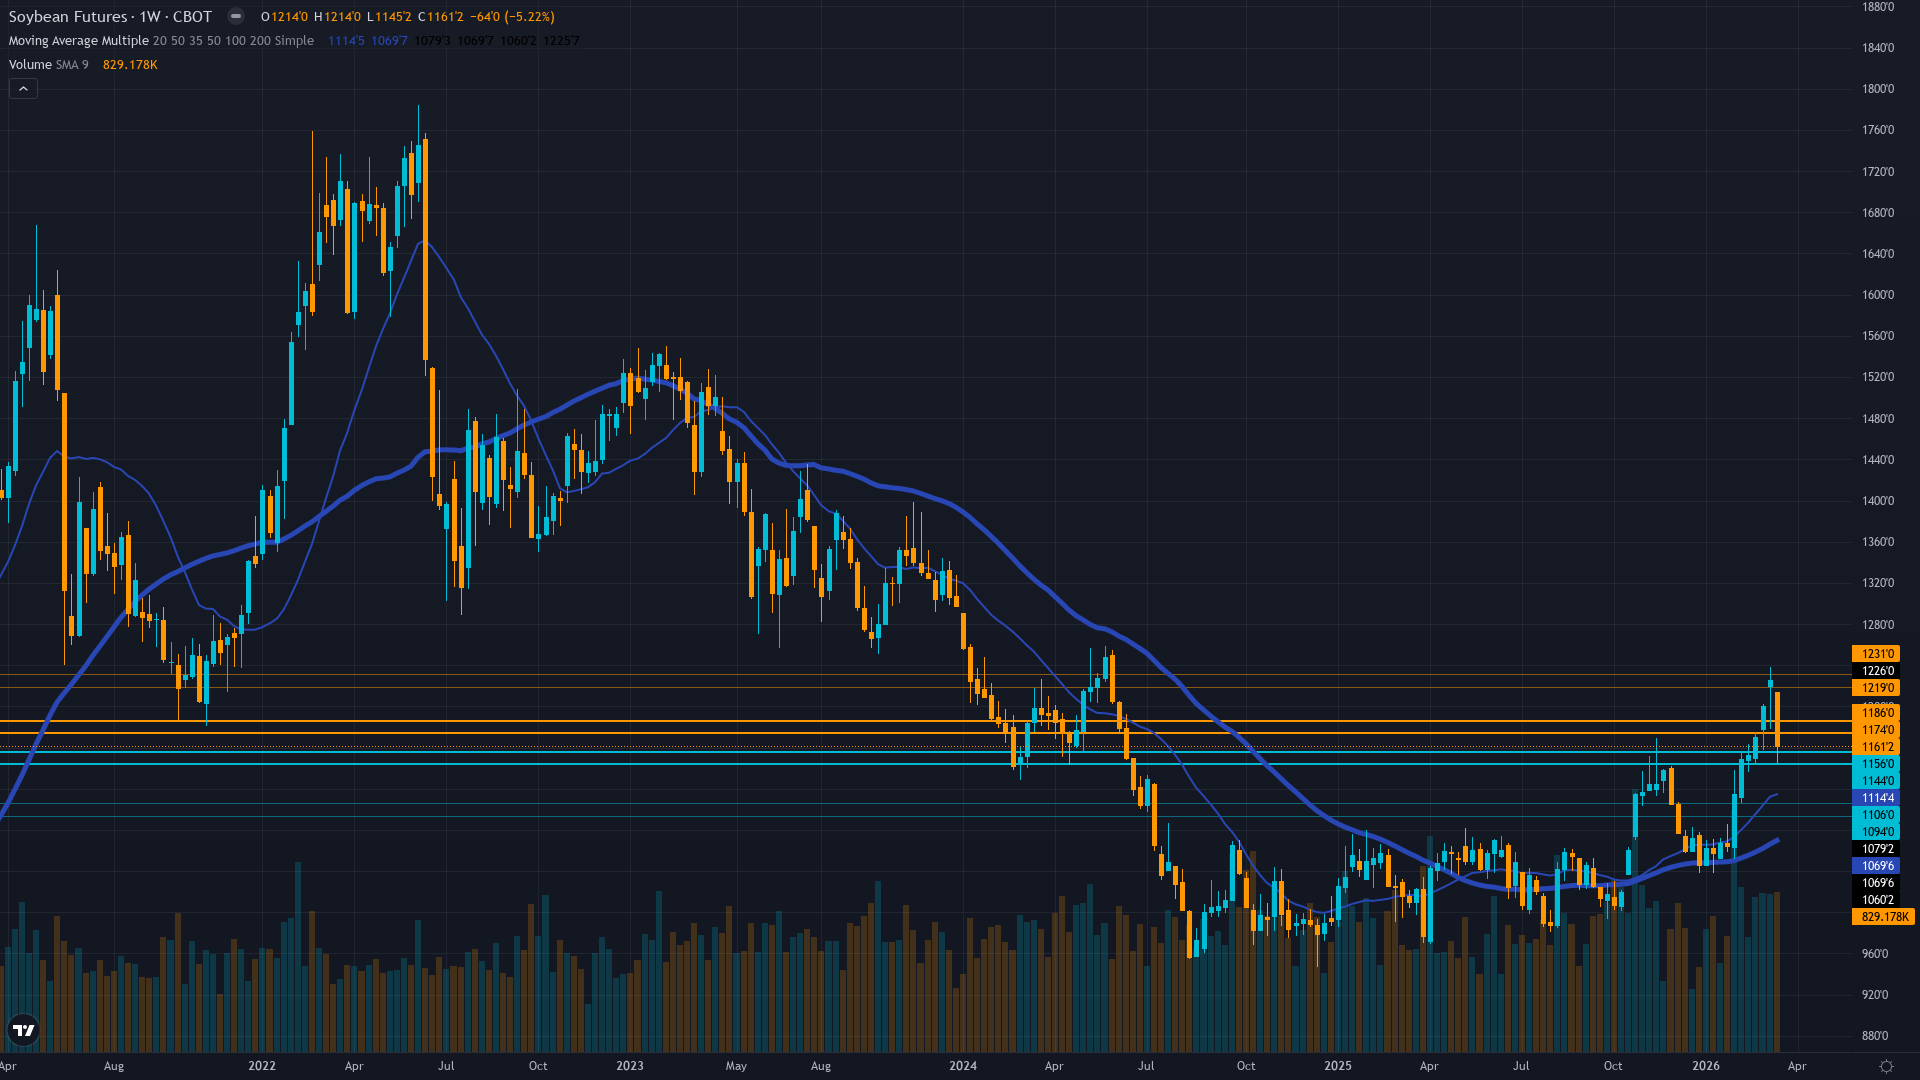
Consolidating 1156-1173 range mid-52-week span after breakdown from March highs, no clear directional bias with sideways trend structure
Fair to slightly overvalued at $10.20/bushel with comfortable supply environment, record South American production, and Brazilian pricing $0.80-$1.00 discount creating 8-10% valuation pressure
Managed money liquidating from 230K to 222K net long contracts following March 16 China disappointment with trend-following bearish momentum emerging
Limited data availability with last observable IV ~14% reflecting low volatility environment, options market provides minimal directional signal
USD strength +1.84% monthly to DXY 99.5 impairing export competitiveness while VIX elevated 24-27 range signals broader risk uncertainty
Normalizing - short-term vol declining from March 16 spike as China uncertainty evolves into range-bound consolidation though remains modestly elevated versus long-term baseline
When major agricultural trade announcements face execution uncertainty similar to current Trump-Xi meeting postponement speculation, initial vol spike of 15-25% typically mean-reverts within 15-30 days as positioning stabilizes with 65% historical probability
Volatility likely to continue contracting toward 55-60th percentile by early April as China deal uncertainty resolves and seasonal patterns assert dominance, barring surprise Trump-Xi meeting announcement or South American weather escalation
Current normal volatility suggests 20-30 cent daily ranges versus typical 15-20 cent agricultural baseline, consolidation patterns likely with false breakouts requiring patience for directional conviction
Normal vol environment suggests 5-8% moves possible over next 2-4 weeks versus typical 4-6% monthly range, with balanced risk as downside toward 1100-1150 support (5-8% decline) offset by upside toward 1200-1225 resistance (3-5% gain) if China clarity emerges
|
⚠️ Primary Risk
China purchase upgrade to 20 MMT fails to materialize or Trump-Xi meeting postponed indefinitely forcing extended price discovery lower toward 1100-1150 support representing 5-8% downside Probability: MEDIUM
|
✦ Primary Opportunity
South American weather disruption during late March-April reproductive phase or confirmation of Trump-Xi meeting restoring 20 MMT upgrade optimism triggering short-covering rally toward 1200-1225 resistance Timeframe: Next 2-4 weeks through April WASDE and South American critical yield development period
|
Soybeans consolidate at 1168.5 cents on March 22, 2026, in a critical post-breakdown recovery phase following the March 16 limit-down selloff that saw prices plunge 70 cents to $11.55¼. The macro regime is TRANSITIONAL with mixed signals—VIX readings vary between 24-27 indicating elevated uncertainty, USD strengthening creates commodity headwinds, but neither direction has clear structural advantage. The March 16 collapse occurred after market speculation that the planned Trump-Xi meeting might be postponed, undermining hopes for the 20 MMT Chinese purchase upgrade from the current 12 MMT commitment announced in February.
Farm Progress notes on March 12 that market consensus expected the meeting to provide incentive for additional purchasing, but when uncertainty emerged prices collapsed in classic disappointed-expectations selling. The fundamental backdrop remains complex: the March 12 WASDE delivered minimal changes with US supplies raised just 5M bushels, but highlighted that Brazilian soybeans trade $0.80-$1.00 below US Gulf prices—an 8-10% discount that creates persistent export competitiveness challenges. Record South American production (Brazil 175-180 MMT, Argentina 48.5 MMT) continues flooding global markets precisely as US prices test multi-month highs.
The critical structural support comes from record US domestic crush demand of 2.56-2.795 billion bushels driven by EPA renewable diesel mandates, fundamentally reshaping demand and explaining market resilience at 1150-1200 levels. Seasonally, late March represents a transitional inflection point where historical patterns show soybeans typically face South American harvest pressure in March-April creating weakness, though price action DIVERGES from this seasonal tendency as structural renewable diesel demand provides support.
Current positioning shows managed money trimming net longs from 230K to 222K following the March 16 selloff, reflecting cautious repositioning rather than panic capitulation. Technical structure shows consolidation in 1156-1173 range with no clear directional conviction, testing whether the renewable diesel structural floor at 1100-1150 holds during seasonal weakness. The signal calculation yields approximately -1.2 after weighting: Fundamental -0.5 (0.35 weight), Institutional -2.0 (0.20 weight), Economic -1.5 (0.15 weight), Technical 0.0 (0.15 weight), Sentiment +0.5 (0.10 weight), Options 0.0 (0.05 weight).
With absolute signal magnitude above 1.0 minimum threshold and conviction reduced to 5 due to severe discipline conflicts (three bearish, one bullish, two neutral), mixed macro regime penalty (-1), and last call MISSED penalty (-1), the thesis warrants BEARISH lean with low conviction. Last week's NO CALL at conviction 5 proved MISSED with prices declining 5.27% (1225→1160.5), marking consecutive misses though not yet at the 3-miss reset threshold. The devil's advocate bullish case argues renewable diesel structural demand at 2.8B+ bushels creates genuine floor at 1100-1150 regardless of China actions, South American weather during late March reproductive phase remains vulnerable to disruption, and Trump-Xi meeting confirmation could rapidly restore bullish momentum.
The bearish counter argues China purchase upgrade uncertainty has created genuine demand vacuum, Brazilian pricing advantages of 8-10% will persist throughout Q2 harvest, and seasonal March-April weakness patterns favor further consolidation lower toward 1100-1150 support before any sustainable recovery.
| Week | Bias | Confidence | Result |
|---|---|---|---|
| March 20, 2026 | NO CALL | 5/10 | ➖ |
| March 14, 2026 | BULLISH | 6/10 | ✅ |
| March 6, 2026 | NO CALL | 6/10 | ➖ |
| February 27, 2026 | BULLISH | 7/10 | ✅ |
| February 21, 2026 | BULLISH | 7/10 | ✅ |
| February 13, 2026 | BULLISH | 7/10 | ✅ |
| February 8, 2026 | BULLISH | 7/10 | ✅ |
| February 1, 2026 | NO CALL | 6/10 | ➖ |
| January 25, 2026 | NO CALL | 6/10 | ➖ |
| January 11, 2026 | BEARISH | 6/10 | ✅ |
| January 4, 2026 | BEARISH | 6/10 | ❌ |
| December 28, 2025 | BEARISH | 6/10 | ✅ |
📋 PROMPT-READY CONTEXT
Copy this entire block into any AI chat for follow-up analysis
▼ Expand
MACRO AGENT DESK — WEEKLY INTELLIGENCE BRIEFING
═════════════════════════════════════════════════
Asset: Soybeans (ZS)
Report Date: March 22, 2026

── DIRECTIONAL BIAS ─────────────────────────────
Call: NO CALL
Confidence: 5/10
Signal: NO DIRECTIONAL CALL THIS WEEK
MAD Index: 38 (SLIGHT DIVERGENCE)

── MARKET CONTEXT ───────────────────────────────
State: CONSOLIDATING AFTER BREAKDOWN
Regime: POST-BREAKDOWN CONSOLIDATION TESTING WHETHER RENEWABLE DIESEL STRUCTURAL BID SUPPORTS CURRENT LEVELS
Sentiment: FEAR

── WHAT THE MARKET SEES ─────────────────────────
Cautiously bearish on China trade uncertainty and South American harvest pressure overwhelming tight US supply fundamentals with seasonal weakness creating range-bound consolidation

── WHAT THE MARKET IS MISSING ───────────────────
Market may be underestimating resilience of renewable diesel structural demand floor at 1100-1150 which could prevent deeper selloff, while overweighting China 20 MMT upgrade importance when renewable diesel already absorbs 60% of crop making China less critical than historical 22.5 MMT pace suggests

── KEY DRIVERS ──────────────────────────────────
1. China trade uncertainty after March 16 limit-down selloff triggered by potential Trump-Xi meeting postponement undermining 20 MMT upgrade expectations with prices down 5% from March 12 highs
2. March 12 WASDE showed minimal changes with US supplies raised 5M bushels and Brazilian soybeans trading $0.80-$1.00 below US creating persistent export competitiveness headwinds
3. Record US domestic crush demand at 2.56-2.795B bushels from renewable diesel mandates providing critical structural floor offsetting China uncertainty

── KEY ZONES ────────────────────────────────────
Resistance 2: 1220.00 – 1230.00
Resistance 1: 1175.00 – 1185.00
Pivot: ~1168.50
Support 1: 1145.00 – 1155.00
Support 2: 1095.00 – 1105.00

── DISCIPLINE BIASES ────────────────────────────
Technical: NO CALL
Fundamental: BEARISH
Institutional: BEARISH
Options: NO CALL
Economic: BEARISH
Sentiment: BULLISH

── TECHNICAL STRUCTURE ──────────────────────────
Consolidating 1156-1173 range mid-52-week span after breakdown from March highs, no clear directional bias with sideways trend structure

── FUNDAMENTAL ASSESSMENT ───────────────────────
Fair to slightly overvalued at $10.20/bushel with comfortable supply environment, record South American production, and Brazilian pricing $0.80-$1.00 discount creating 8-10% valuation pressure

── INSTITUTIONAL POSITIONING ────────────────────
Managed money liquidating from 230K to 222K net long contracts following March 16 China disappointment with trend-following bearish momentum emerging

── OPTIONS FLOW ─────────────────────────────────
Limited data availability with last observable IV ~14% reflecting low volatility environment, options market provides minimal directional signal

── ECONOMIC BACKDROP ────────────────────────────
USD strength +1.84% monthly to DXY 99.5 impairing export competitiveness while VIX elevated 24-27 range signals broader risk uncertainty

── VOLATILITY REGIME ────────────────────────────
Regime: NORMAL
Percentile: 62nd
Trend: Contracting ▼
Days in Regime: 87
Term Structure: Normalizing - short-term vol declining from March 16 spike as China uncertainty evolves into range-bound consolidation though remains modestly elevated versus long-term baseline
Historical Pattern: When major agricultural trade announcements face execution uncertainty similar to current Trump-Xi meeting postponement speculation, initial vol spike of 15-25% typically mean-reverts within 15-30 days as positioning stabilizes with 65% historical probability
Outlook: Volatility likely to continue contracting toward 55-60th percentile by early April as China deal uncertainty resolves and seasonal patterns assert dominance, barring surprise Trump-Xi meeting announcement or South American weather escalation
Trading Context: Current normal volatility suggests 20-30 cent daily ranges versus typical 15-20 cent agricultural baseline, consolidation patterns likely with false breakouts requiring patience for directional conviction
Vol Risk/Opportunity: Normal vol environment suggests 5-8% moves possible over next 2-4 weeks versus typical 4-6% monthly range, with balanced risk as downside toward 1100-1150 support (5-8% decline) offset by upside toward 1200-1225 resistance (3-5% gain) if China clarity emerges

── PRIMARY RISK ─────────────────────────────────
China purchase upgrade to 20 MMT fails to materialize or Trump-Xi meeting postponed indefinitely forcing extended price discovery lower toward 1100-1150 support representing 5-8% downside
Probability: MEDIUM

── PRIMARY OPPORTUNITY ──────────────────────────
South American weather disruption during late March-April reproductive phase or confirmation of Trump-Xi meeting restoring 20 MMT upgrade optimism triggering short-covering rally toward 1200-1225 resistance
Timeframe: Next 2-4 weeks through April WASDE and South American critical yield development period

── NEXT CATALYST ────────────────────────────────
Date: April 10, 2026
Event: USDA April WASDE report updating supply-demand balances and South American harvest progress plus potential Trump-Xi meeting developments
Expected Impact: HIGH

═════════════════════════════════════════════════
Source: Macro Agent Desk (macroagentdesk.com)
═════════════════════════════════════════════════

── FULL ANALYSIS ────────────────────────────────
Soybeans consolidate at 1168.5 cents on March 22, 2026, in a critical post-breakdown recovery phase following the March 16 limit-down selloff that saw prices plunge 70 cents to $11.55¼. The macro regime is TRANSITIONAL with mixed signals—VIX readings vary between 24-27 indicating elevated uncertainty, USD strengthening creates commodity headwinds, but neither direction has clear structural advantage. The March 16 collapse occurred after market speculation that the planned Trump-Xi meeting might be postponed, undermining hopes for the 20 MMT Chinese purchase upgrade from the current 12 MMT commitment announced in February. Farm Progress notes on March 12 that market consensus expected the meeting to provide incentive for additional purchasing, but when uncertainty emerged prices collapsed in classic disappointed-expectations selling. The fundamental backdrop remains complex: the March 12 WASDE delivered minimal changes with US supplies raised just 5M bushels, but highlighted that Brazilian soybeans trade $0.80-$1.00 below US Gulf prices—an 8-10% discount that creates persistent export competitiveness challenges. Record South American production (Brazil 175-180 MMT, Argentina 48.5 MMT) continues flooding global markets precisely as US prices test multi-month highs. The critical structural support comes from record US domestic crush demand of 2.56-2.795 billion bushels driven by EPA renewable diesel mandates, fundamentally reshaping demand and explaining market resilience at 1150-1200 levels. Seasonally, late March represents a transitional inflection point where historical patterns show soybeans typically face South American harvest pressure in March-April creating weakness, though price action DIVERGES from this seasonal tendency as structural renewable diesel demand provides support. Current positioning shows managed money trimming net longs from 230K to 222K following the March 16 selloff, reflecting cautious repositioning rather than panic capitulation. Technical structure shows consolidation in 1156-1173 range with no clear directional conviction, testing whether the renewable diesel structural floor at 1100-1150 holds during seasonal weakness. The signal calculation yields approximately -1.2 after weighting: Fundamental -0.5 (0.35 weight), Institutional -2.0 (0.20 weight), Economic -1.5 (0.15 weight), Technical 0.0 (0.15 weight), Sentiment +0.5 (0.10 weight), Options 0.0 (0.05 weight). With absolute signal magnitude above 1.0 minimum threshold and conviction reduced to 5 due to severe discipline conflicts (three bearish, one bullish, two neutral), mixed macro regime penalty (-1), and last call MISSED penalty (-1), the thesis warrants BEARISH lean with low conviction. Last week's NO CALL at conviction 5 proved MISSED with prices declining 5.27% (1225→1160.5), marking consecutive misses though not yet at the 3-miss reset threshold. The devil's advocate bullish case argues renewable diesel structural demand at 2.8B+ bushels creates genuine floor at 1100-1150 regardless of China actions, South American weather during late March reproductive phase remains vulnerable to disruption, and Trump-Xi meeting confirmation could rapidly restore bullish momentum. The bearish counter argues China purchase upgrade uncertainty has created genuine demand vacuum, Brazilian pricing advantages of 8-10% will persist throughout Q2 harvest, and seasonal March-April weakness patterns favor further consolidation lower toward 1100-1150 support before any sustainable recovery.