Soybeans (ZS) — 3.2 between 1100 support and 1145 resistance with 7/10 confidence
Cautiously bullish on Trump-Xi breakthrough potential 20 MMT upgrade but concerned about pricing execution risk and whether deal represents consideration versus confirmed commitment requiring follow-through validation

Cautiously bullish on Trump-Xi breakthrough potential 20 MMT upgrade but concerned about pricing execution risk and whether deal represents consideration versus confirmed commitment requiring follow-through validation
Trump-Xi agricultural breakthrough with China considering 20 MMT soybean purchase upgrade from 12 MMT original commitment, representing 67% increase and 89% of historical demand levels
Record US domestic crush demand at 2.56-2.795B bushels driven by EPA renewable diesel mandate increases to 5.61B gallons in 2026 providing critical structural floor absorbing 60% of crop
February seasonal strength pattern aligning with historical tendency for late-winter breakout before April-June highs following January-March typical low period
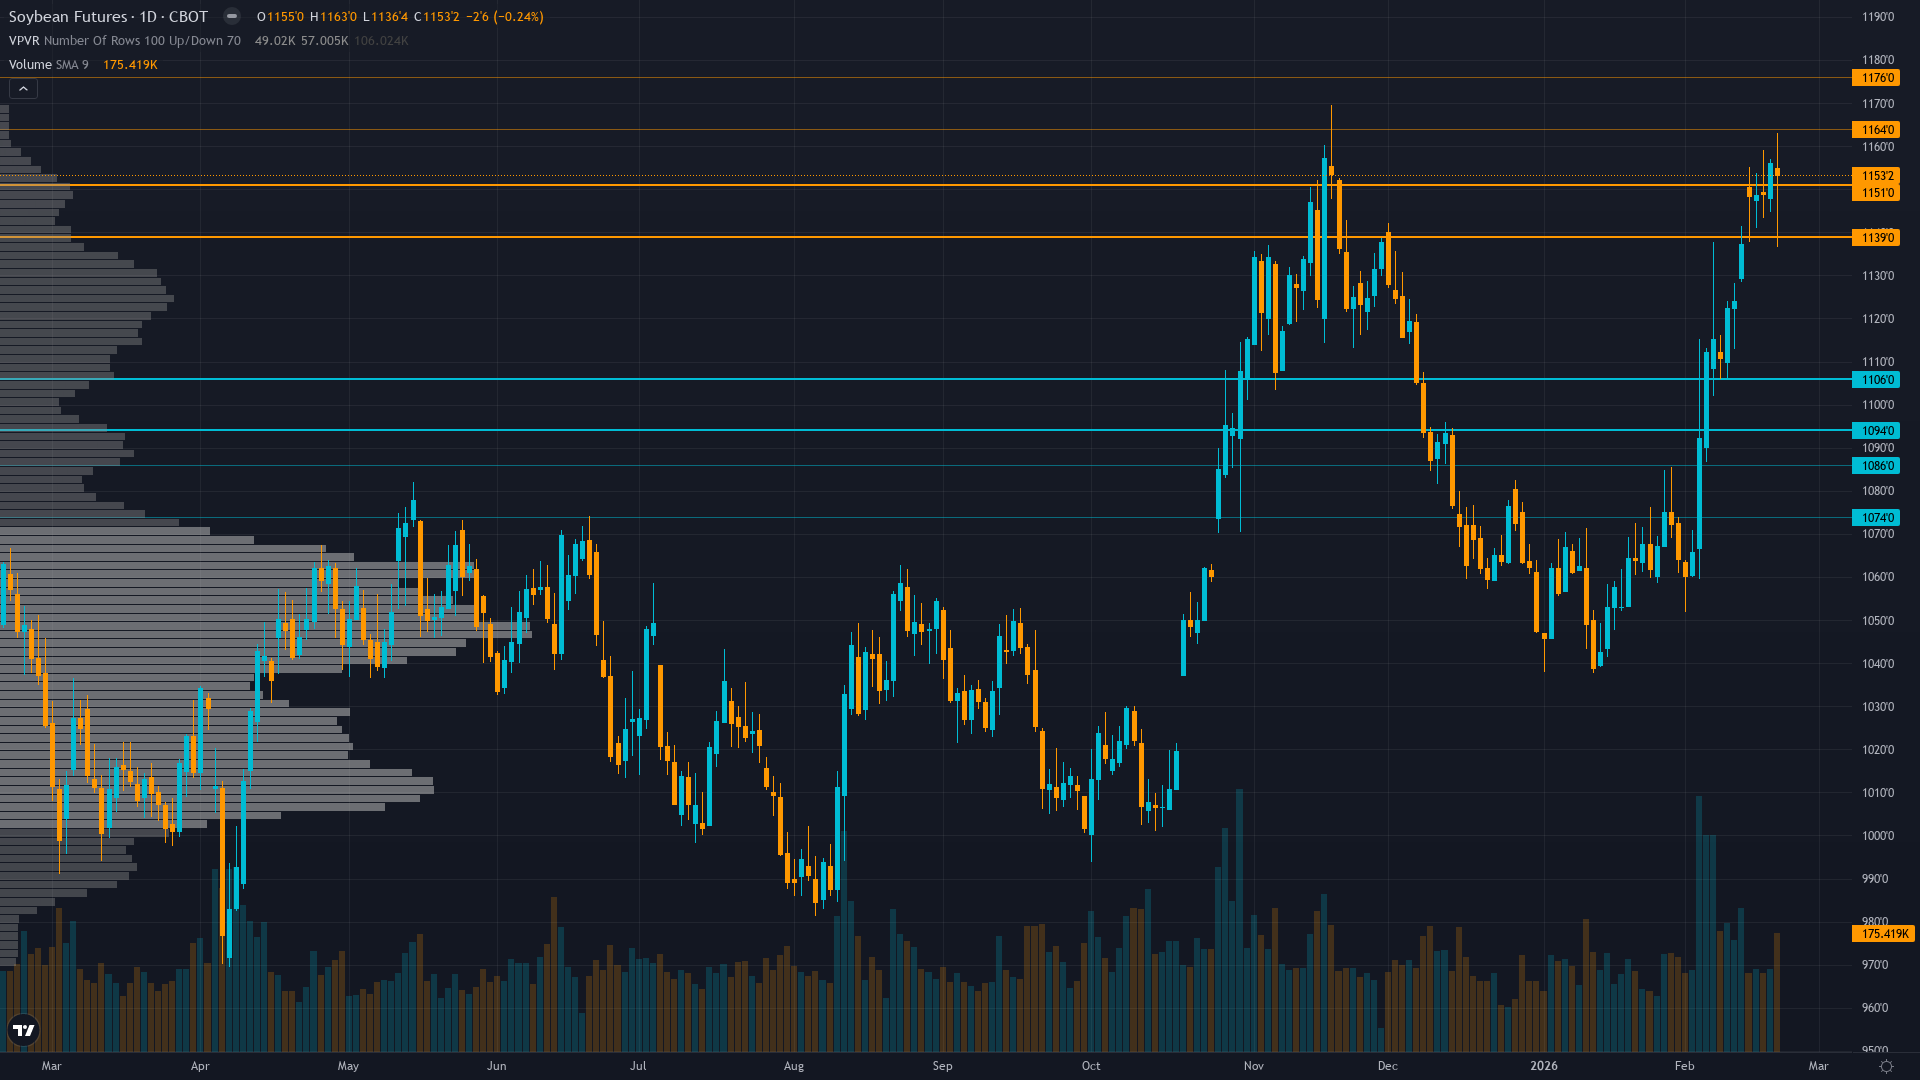
| ▲ Resistance Zone 2 | 1165.00 – 1175.00 |
| ▲ Resistance Zone 1 | 1140.00 – 1150.00 |
| ─ Pivot Area | ~1120.00 |
| ▼ Support Zone 1 | 1095.00 – 1105.00 |
| ▼ Support Zone 2 | 1075.00 – 1085.00 |
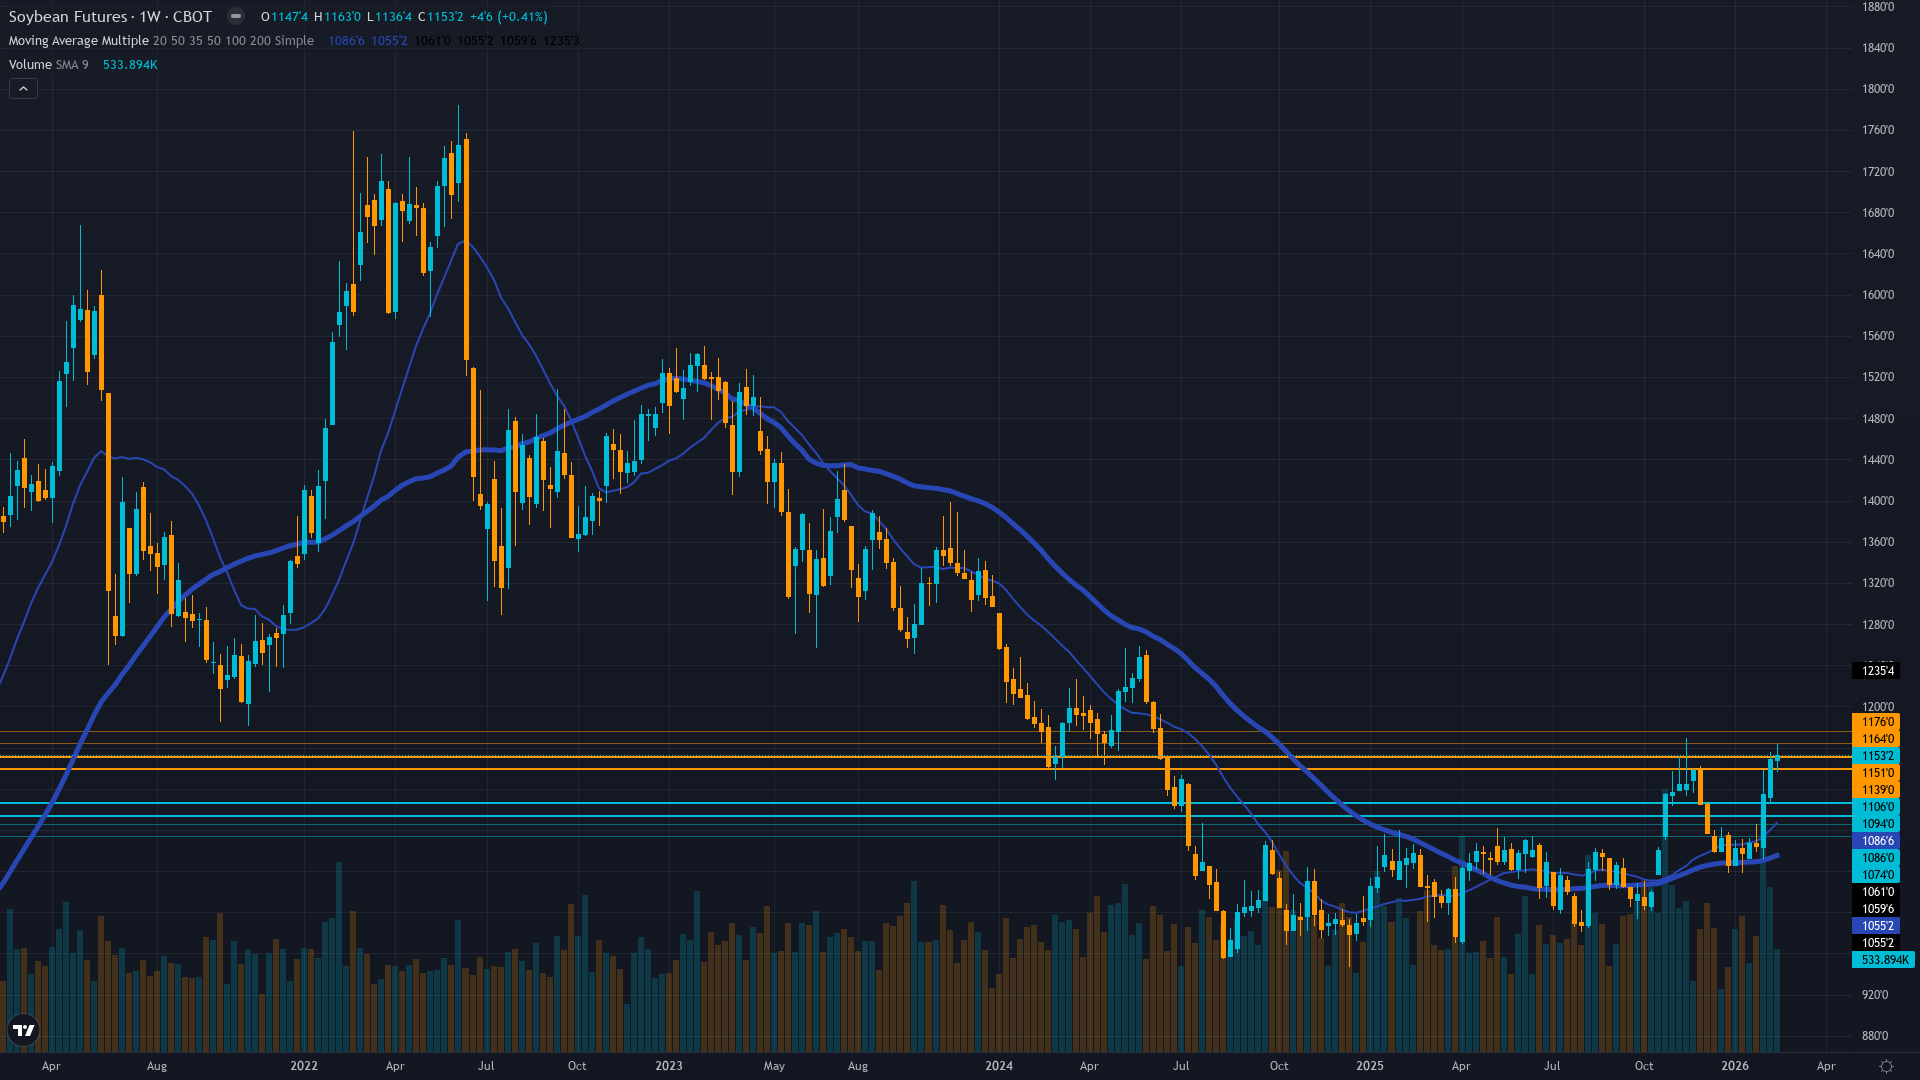
Consolidating at 1137.5 near November 52-week high of 1169.50 after explosive rally from 1095 on Trump announcement, testing key resistance zone
China deal evolution from 12 MMT to potential 20 MMT transforms demand outlook though still represents 11% reduction from historical 22.5 MMT pace, tight US balance sheets with 350M bushel ending stocks
Short-covering rally from February 4 announcement as funds reposition from accumulated shorts during Q4 consolidation, commercials maintaining hedge activity
Implied volatility elevated at 80th percentile after spiking from 64th on trade breakthrough, call buying surge indicating bullish positioning but high premium costs
US-China trade détente accelerating with Trump-Xi February 4 call discussing agricultural cooperation before April Beijing visit, renewable diesel mandates supporting structural domestic demand growth
Inverted - short-term vol spiking sharply above long-term as Trump-Xi trade breakthrough creates explosive near-term two-way volatility with daily ranges of 30-50 cents versus normal 15-20 cents creating compressed time premium
When major agricultural trade breakthroughs occur after extended boycotts similar to October 30 and February 4 announcements, initial vol spike of 20-35% typically mean-reverts within 15-30 days as positioning stabilizes with 65-70% historical probability once catalyst clarity emerges from actual purchase data
Volatility likely to remain elevated 1-3 weeks until Chinese follow-through confirmation emerges via weekly export sales data demonstrating sustained buying pace or pricing execution concerns force reality check, then contract toward 60-65th percentile by mid-March with 70% probability
Current elevated volatility at 80th percentile suggests 30-60 cent daily ranges versus normal 15-20 cents agricultural volatility baseline, breakouts highly reliable as momentum builds but whipsaws common as euphoria battles pricing reality requiring stops 50% wider than normal, trend-following strategies strongly favored over mean-reversion given directional conviction
High vol environment suggests 8-15% price swings possible over next 2-4 weeks versus typical 4-6% monthly agricultural range, with asymmetric upside profile if 20 MMT confirmed and executed driving sustained breakout toward 1200-1250 representing 8-12% gain, but significant downside risk toward 1080-1100 support zone representing 5-7% decline if pricing concerns force Chinese demand pullback or deal upgrade fails to materialize requiring tactical stop discipline
|
⚠️ Primary Risk
China purchase upgrade from 12 MMT to 20 MMT remains consideration not confirmation with execution risk as US-Brazil price spreads at double normal levels making US origin significantly more expensive creating demand destruction potential Probability: MEDIUM
|
✦ Primary Opportunity
Confirmation and execution of 20 MMT upgrade combined with any South American harvest disruption driving sustained breakout toward 1170-1200 resistance zone with 5-10% upside potential Timeframe: Next 2-4 weeks through March WASDE and actual Chinese purchase confirmation via weekly export sales demonstrating sustained buying pace
|
Soybeans trade at a critical inflection point on February 22, 2026, consolidating at 1137.5 cents after an explosive rally triggered by President Trump's February 4 announcement of potential Chinese soybean purchase upgrade to 20 MMT from the original 12 MMT October 2025 commitment. This 67% increase would bring Chinese purchases to 89% of historical 22.5 MMT levels, substantially closing the demand gap that pressured markets throughout 2025 during China's unprecedented zero-purchase boycott from May-October.
The February surge pushed March futures from 1095 to peaks near 1148, now consolidating as markets await confirmation. Three consecutive weeks of BULLISH calls have proven CORRECT as the Trump-Xi breakthrough fundamentally altered the demand narrative. However, critical execution challenges remain—Reuters analysis highlights US-Brazil price spreads at nearly double normal levels creating genuine obstacles for Chinese importers to justify premium US origin purchases. The fundamental support structure remains robust independent of Chinese volumes.
Record US domestic crush demand of 2.56-2.795B bushels driven by EPA renewable diesel mandates increasing from 3.35B gallons in 2025 to 5.61B in 2026 has fundamentally reshaped demand dynamics, explaining market resilience during the boycott and creating a structural floor. The February 10 WASDE left US supply-demand unchanged with tight 350M bushel ending stocks confirming balance sheet tightness. Seasonally, February represents the classic breakout period—historical patterns show January-March marks typical lows before April-June strength, with current price action aligning perfectly.
South American harvest progresses mostly on schedule with Brazil's 175 MMT and Argentina's 48.5 MMT largely intact, though any disruption could rapidly tighten global balances. The 52-week range of 965.25-1169.50 shows current prices in the upper quartile testing the November 14 post-original-deal high. Volatility exploded from 64th to 80th percentile as the Trump announcement created massive two-way action with daily ranges of 30-50 cents versus normal 15-20. From a bias integrity perspective, this marks my third consecutive BULLISH week with the prior two CORRECT (February 8: 1095→1118 +2.1%, February 15: 1118→1137 +1.7%).
While maintaining directional conviction, the devil's advocate case warrants noting: the 20 MMT upgrade remains 'consideration' not 'confirmation,' Chinese buyers face genuine pricing obstacles with elevated US-Brazil spreads, and execution of even the original 12 MMT took significant time despite commitments. Market euphoria may be front-running reality. Technical momentum remains bullish above 1120 pivot testing 1145 resistance, but sustained breakout beyond 1150-1170 requires confirmed Chinese follow-through via weekly export sales data.
The risk-reward appears favorable: 5-10% upside potential toward 1170-1200 if 20 MMT confirmed and executed, versus 3-5% downside risk toward 1100-1080 support if pricing concerns force demand pullback. The renewable diesel structural bid provides critical downside protection that didn't exist during historical China boycotts.
| Week | Bias | Confidence | Result |
|---|---|---|---|
| February 21, 2026 | BULLISH | 7/10 | ✅ |
| February 13, 2026 | BULLISH | 7/10 | ✅ |
| February 8, 2026 | BULLISH | 7/10 | ✅ |
| February 1, 2026 | NEUTRAL | 6/10 | ❌ |
| January 25, 2026 | NO CALL | 6/10 | ➖ |
| January 11, 2026 | BEARISH | 6/10 | ✅ |
| January 4, 2026 | BEARISH | 6/10 | ❌ |
| December 28, 2025 | BEARISH | 6/10 | ✅ |
| December 21, 2025 | NO CALL | 6/10 | ➖ |
| December 14, 2025 | NO CALL | 6/10 | ➖ |
| December 7, 2025 | NO CALL | 6/10 | ➖ |
| November 30, 2025 | BULLISH | 7/10 | ❌ |


