Soybeans (ZS) — Trump-Xi breakthrough with potential 20 MMT soybean purchase commitment…
Cautiously bullish on Trump-Xi breakthrough potential upgrade to 20 MMT but concerned about pricing execution risk and whether deal represents consideration versus confirmation

Cautiously bullish on Trump-Xi breakthrough potential upgrade to 20 MMT but concerned about pricing execution risk and whether deal represents consideration versus confirmation
Trump-Xi breakthrough with potential 20 MMT soybean purchase commitment representing 67% increase from original 12 MMT deal
Record US domestic crush demand at 2.56-2.795B bushels driven by renewable diesel expansion creating structural floor
February seasonal patterns showing typical low-to-breakout tendency with historical strength developing late January through April-June
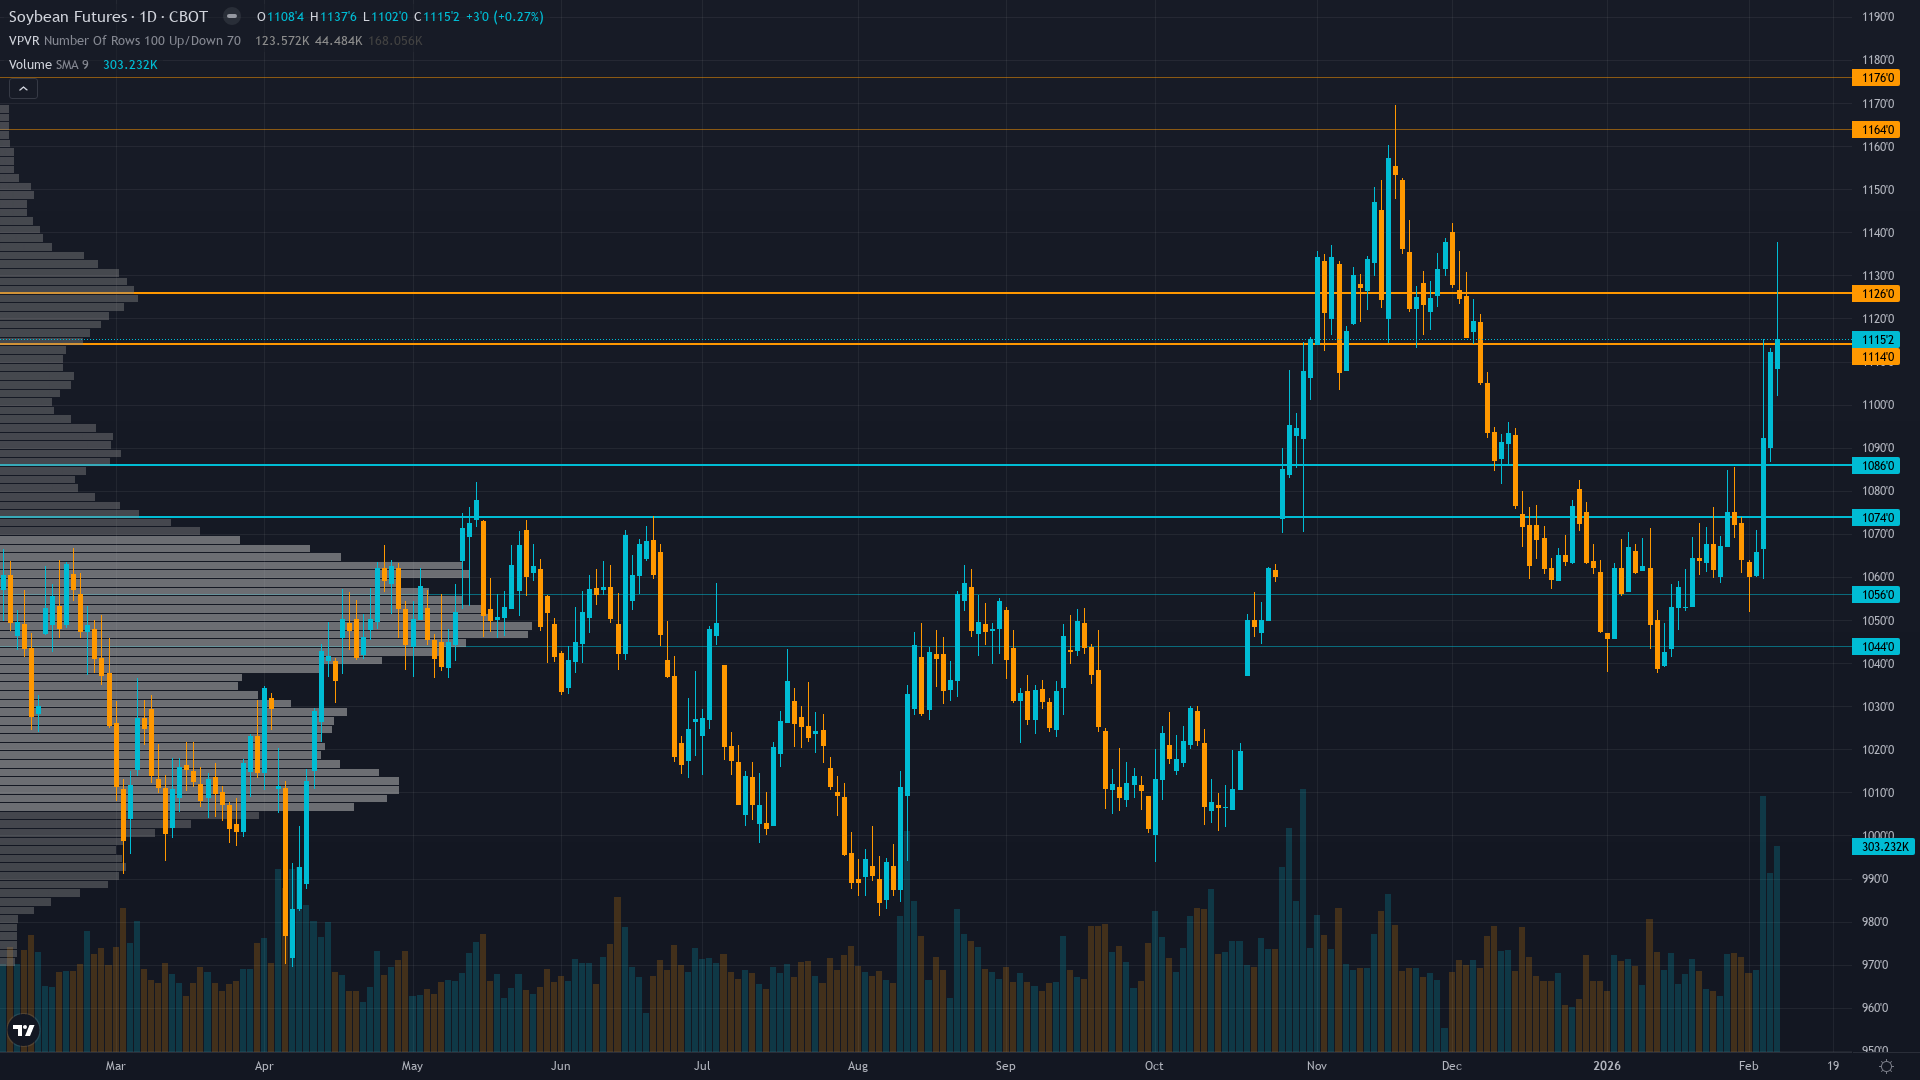
| ▲ Resistance Zone 2 | 1165.00 – 1175.00 |
| ▲ Resistance Zone 1 | 1115.00 – 1125.00 |
| ─ Pivot Area | ~1100.00 |
| ▼ Support Zone 1 | 1075.00 – 1085.00 |
| ▼ Support Zone 2 | 1045.00 – 1055.00 |
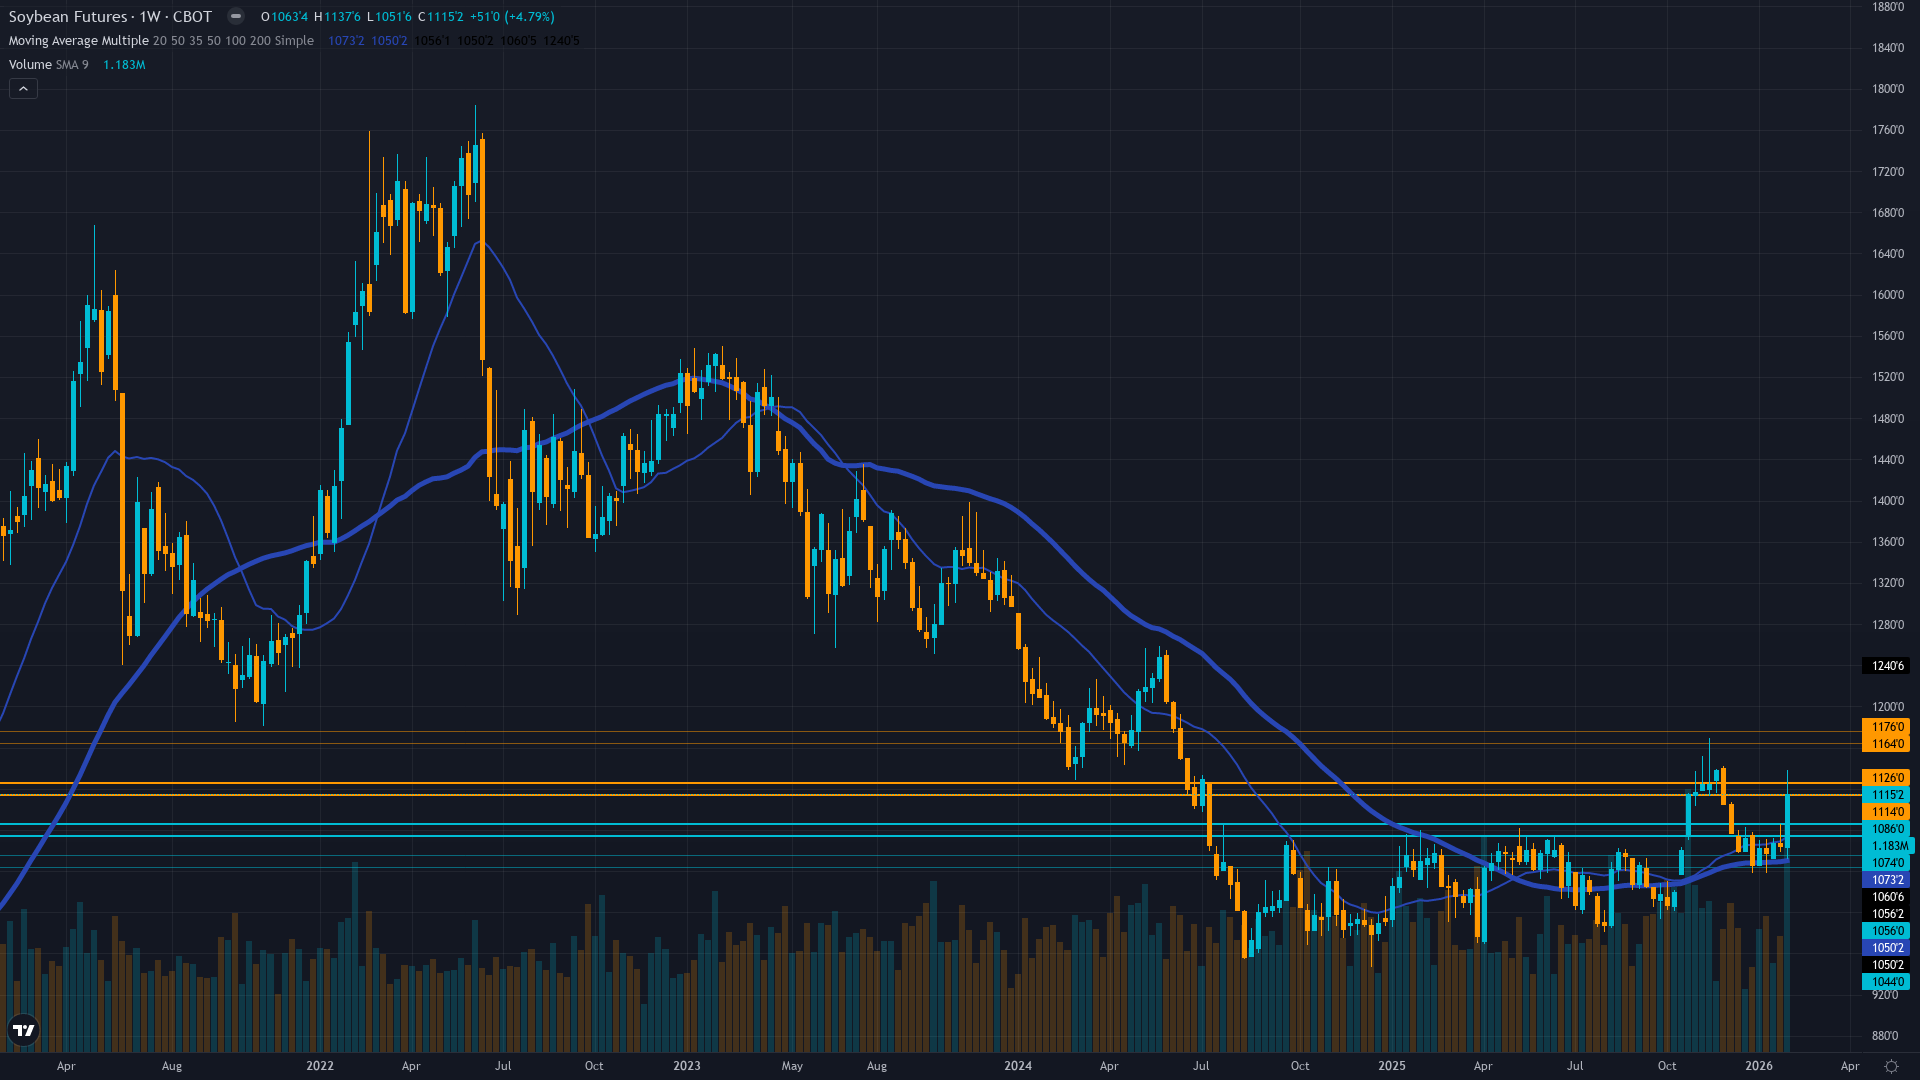
Breaking above 1100-1112 consolidation with explosive momentum after Trump announcement, testing November 52-week high of 1169.50
China deal evolution from 12 MMT to potential 20 MMT transforms demand outlook but still represents 11% reduction from historical 22.5 MMT pace
Massive short-covering rally underway as funds scramble to cover positions established during China boycott period with fresh long positioning emerging
Implied volatility spiking from 64th to estimated 78-80th percentile on trade breakthrough creating two-way action with call buying surging
US-China trade détente accelerating with Trump-Xi call on February 4 discussing Taiwan and agricultural trade creating positive momentum before April Beijing visit
Inverted - short-term vol spiking above long-term as Trump-Xi trade breakthrough creates explosive near-term two-way action with daily ranges of 30-50 cents
When major trade breakthroughs occur after extended boycotts similar to current situation, initial vol spike of 20-30% typically mean-reverts within 15-30 days as positioning stabilizes with 65% probability
Volatility likely to remain elevated 1-3 weeks until Chinese follow-through confirmation emerges or pricing execution concerns force reality check
Current elevated volatility suggests 30-60 cent daily ranges versus normal 15-20 cents, breakouts highly reliable but whipsaws common as euphoria battles pricing reality requiring wider stops
High vol environment suggests 8-15% moves possible over next 2-4 weeks versus typical 4-6%, with asymmetric upside if 20 MMT confirmed and executed but significant downside risk if pricing concerns force Chinese demand pullback
|
⚠️ Primary Risk
China purchase commitment upgrade from 12 MMT to 20 MMT remains consideration not confirmation with Reuters noting Chinese importers face higher prices creating execution risk Probability: MEDIUM
|
✦ Primary Opportunity
Further upgrade to 20 MMT combined with any South American weather disruption during February harvest could drive prices toward 1150-1170 resistance Timeframe: Next 2-4 weeks through February WASDE and actual Chinese follow-through confirmation
|
Soybeans exploded higher on February 4-6, 2026, surging to $11.16 per bushel (highest since December 2025) after President Trump announced an 'excellent' call with Chinese President Xi Jinping. Trump posted on social media that China is considering increasing US soybean purchases to 20 million metric tons for the current season, up 67% from the 12 MMT commitment established in the October 30, 2025 breakthrough deal that ended China's unprecedented six-month zero-purchase boycott. This represents a game-changing development: while still 11% below historical 22.5 MMT pace, the potential upgrade to 20 MMT would substantially close the demand gap that has pressured markets since summer 2025.
March soybean futures jumped 30-50 cents on the news, with Trading Economics reporting prices reaching $11.16/bushel by February 6. The rally comes as China already fulfilled the original 12 MMT commitment by January 21, purchasing all quantities ahead of schedule. However, Reuters cautions that Chinese importers face execution challenges with US-Brazil price spreads now nearly double normal levels, making US origin significantly more expensive. The fundamental backdrop remains complex: Fortune reported January 21 that China completed the 12 MMT purchases just as new tariffs were announced, while February 5 Reuters analysis highlighted that further purchases face pricing headwinds with CBOT premiums to Brazilian benchmarks elevated.
Record US domestic crush demand of 2.56-2.795 billion bushels continues providing critical structural support, driven by EPA's renewable diesel mandate increase from 3.35 billion gallons in 2025 to 5.61 billion in 2026 and 5.86 billion in 2027. This renewable diesel boom has fundamentally reshaped demand, explaining market resilience during the boycott. Seasonally, February represents a critical inflection point: historical patterns show January-March typically marks seasonal lows before April-June strength emerges, with Oklahoma Farm Report analysis on February 4 confirming seasonal patterns favor disciplined marketing decisions during this transition.
South American weather has improved through late January-early February with Brazil's harvest progressing well, though Successful Farming noted on February 3 that precipitation will improve moisture for late-developing beans but may delay harvest in some regions. The 52-week range of 965.25-1169.50 shows current prices in the upper third, with the November 14 high of 1169.50 now within striking distance. Volatility has exploded from the 64th percentile to estimated 78-80th percentile as the Trump announcement created massive two-way action with daily ranges expanding to 30-50 cents versus normal 15-20 cents.
The market faces a critical test: can the potential 20 MMT upgrade be confirmed and executed at current elevated price levels, or will the US-Brazil spread compression force either Chinese demand destruction or US price corrections? The forward outlook hinges on three variables: actual Chinese follow-through confirmation, February WASDE supply-demand updates, and whether South American harvest proceeds smoothly or encounters disruptions. Technical momentum is clearly bullish above the 1100 pivot, but execution risk on the upgraded Chinese commitment creates tactical uncertainty for sustained breakout continuation.
| Week | Bias | Confidence |
|---|---|---|
| February 8, 2026 | BULLISH | 7/10 |
| February 1, 2026 | NEUTRAL | 6/10 |
| January 25, 2026 | NEUTRAL | 6/10 |
| January 18, 2026 | NEUTRAL | 6/10 |
| January 11, 2026 | BEARISH | 6/10 |
| January 4, 2026 | BEARISH | 6/10 |
| December 28, 2025 | NEUTRAL | 6/10 |
| December 21, 2025 | NEUTRAL | 6/10 |
| December 14, 2025 | NEUTRAL | 6/10 |
| December 7, 2025 | NEUTRAL | 6/10 |
| November 30, 2025 | BULLISH | 7/10 |
| November 23, 2025 | BULLISH | 7/10 |


