30-Year Treasury (ZB) — FOMC policy decision March 18-19 at 2:00 PM with Powell press conference at…
Market pricing 92% hold at March 18-19 FOMC with only one cut expected for all of 2026; bonds consolidating 112-118 range awaiting FOMC clarity on terminal rate trajectory

Market pricing 92% hold at March 18-19 FOMC with only one cut expected for all of 2026; bonds consolidating 112-118 range awaiting FOMC clarity on terminal rate trajectory
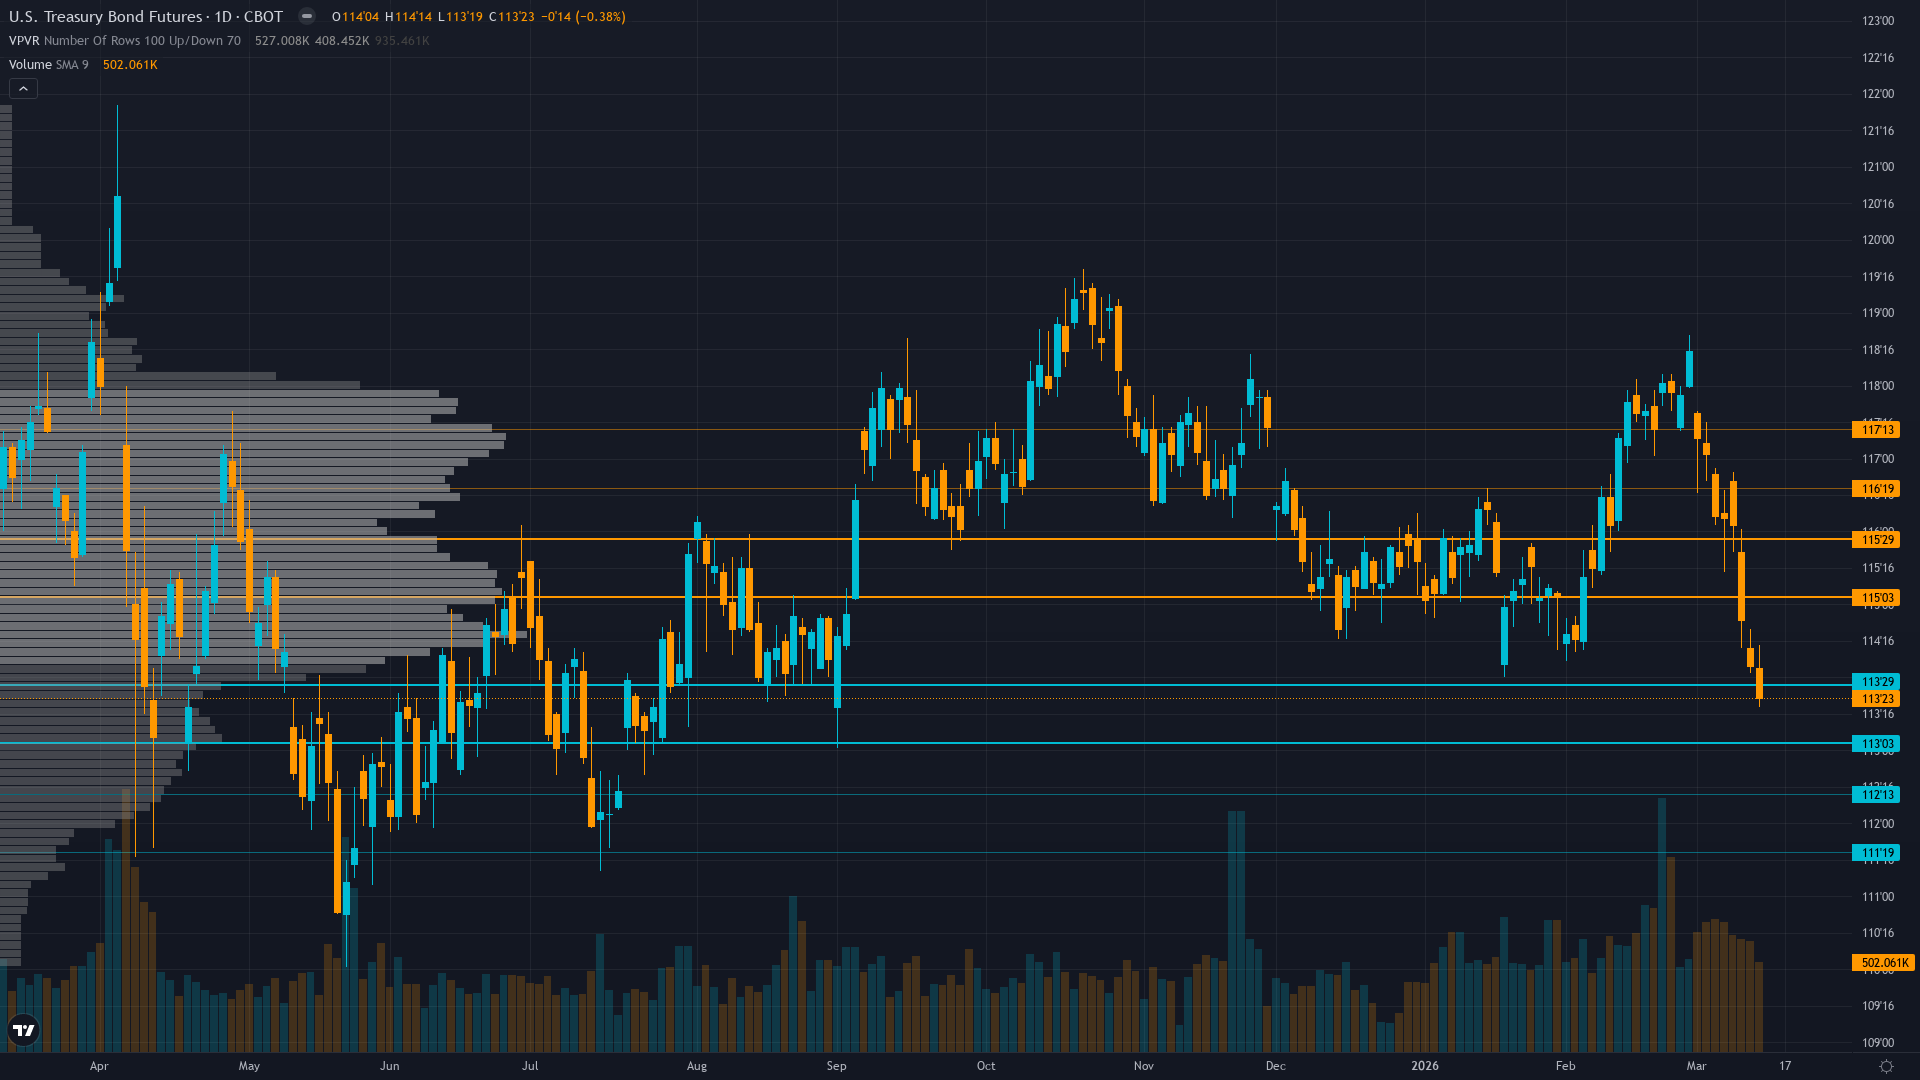
Violent breakdown from 116 to 113.72 last week confirms post-February rally exhaustion with FOMC blackout period creating informational void ahead of March 18-19 decision
MOVE volatility index at 91.17 up 22% weekly and 41% monthly from compressed levels signaling expanding uncertainty despite VIX elevated at 27.85 creating mixed risk signals
Fresh fundamental catalyst from CBO March 9 report showing FY2026 deficit at $1.9 trillion with $308B February issuance maintaining structural supply pressure on long duration
| ▼ Resistance Zone 2 | 116.500 – 117.500 |
| ▼ Resistance Zone 1 | 115.000 – 116.000 |
| ─ Pivot Area | ~114.340 |
| ▲ Support Zone 1 | 113.000 – 114.000 |
| ▲ Support Zone 2 | 111.500 – 112.500 |
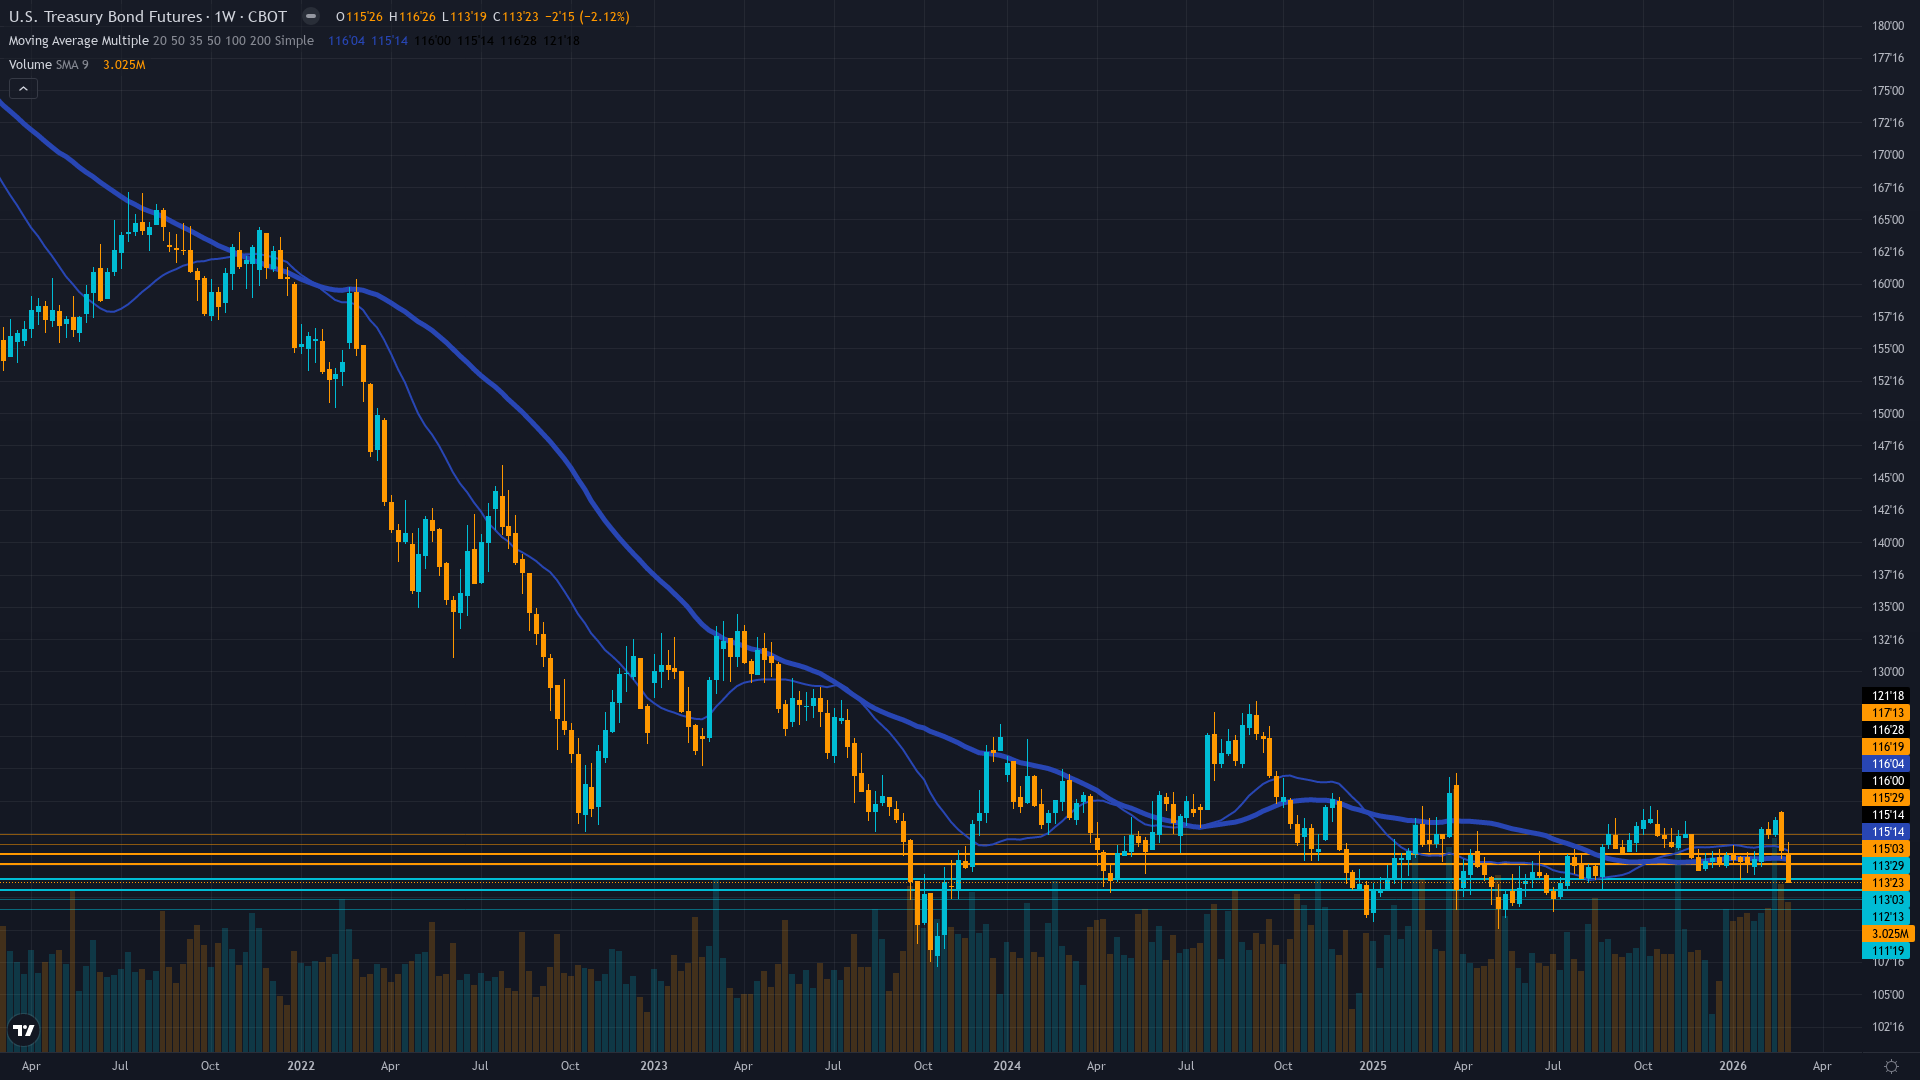
Breakdown structure complete with former 116.5 support now resistance; current price at 114.34 testing mid-range between 113.5 support and 115.5 resistance with Strong Sell technical rating
Fed at 3.50-3.75% with 92% probability of hold at March 18-19 FOMC; FY2026 deficit $1.9T with $308B February issuance creating structural bearish repricing environment for long duration
Defensive deleveraging continues with concerning rotation signals from Treasuries to international bonds per prior weeks though latest COT data unavailable
MOVE index at 91.17 showing significant elevation from recent 60s compression but pulling back 4.3% in 24 hours suggesting volatility spike moderating ahead of FOMC; ZB options thin with limited directional signal
February CPI at 2.5% YoY sticky above 2% target with weak payrolls -92k creating conflicting signals; Fed Chair Powell term ends May 2026 adding leadership uncertainty; PPI due March 18 same day as FOMC
Normal - Short-term vol at 11.8 below medium-term 13.2 as MOVE expands from compressed regime toward normalized levels; expansion accelerating with MOVE at 91.17 up 22% weekly though pulling back 4.3% in 24 hours
Current MOVE expansion from 60s lows to 91.17 represents mid-stage of typical mean reversion pattern; historical precedent shows 20-30% spikes within 1-2 weeks following such compressions suggesting potential for further expansion though recent pullback suggests moderation
Moderate probability 60-70% of continued expansion within 3-5 trading days as MOVE continues mean reversion from artificial compression toward 95-105 range before March 18-19 FOMC resolution
Volatility expansion creating elevated environment; daily ranges expanding from 0.5 handles to 1.0-1.5 handles with maximum binary risk into March 18-19 FOMC; current 114.34 price in consolidation zone between 113.5-115.5 awaiting catalyst
Moderate asymmetry with MOVE at 91.17 providing both risk (further expansion to 95-105 creating violent moves) and opportunity (volatility peaks often mark inflection points) but binary FOMC catalyst 3-4 days away dominates all other considerations limiting directional conviction
|
⚠️ Primary Risk
FOMC on March 18-19 surprises dovish with dot plot showing more cuts than market expects (currently only one in 2026) triggering violent short covering rally above 116.5 resistance toward 118-120 zone invalidating bearish signal Probability: MEDIUM
|
✦ Primary Opportunity
Continued breakdown below 113.5 support on hawkish FOMC rhetoric or strong economic data forcing terminal rate repricing higher with cascade potential to 112 major support representing additional 1.5-2.0% decline opportunity Timeframe: Next 1-2 weeks through March 18-19 FOMC and immediate post-decision repricing
|
ZB Treasury bond futures trade at 114.34 on March 15, 2026, consolidating in the aftermath of last week's violent -1.97% breakdown that vindicated this desk's BEARISH call and extended the post-February rally exhaustion. The asset sits in a critical TRANSITIONAL macro regime—VIX elevated at 27.85 signals broad market fear driving safe-haven demand, yet bonds continue selling off, exposing profound skepticism about Fed easing trajectory despite risk-off conditions. This paradox defines current market structure.
The March 18-19 FOMC meeting 3-4 days away dominates all forward analysis with 92%+ probability of hold at 3.50-3.75% already priced, but the updated dot plot and Powell's forward guidance will determine whether the December hawkish pivot (projecting only 2 cuts through 2027 before terminal at 3%) remains intact or moderates. Fresh fundamental catalyst emerged March 9 via CBO report confirming FY2026 deficit trajectory worsening to $1.9 trillion with February alone requiring $308 billion in new issuance—a $142 billion increase versus prior year validating persistent supply pressure that fundamentally reprices long duration lower.
The conflicting data environment creates maximum uncertainty: February CPI at 2.5% YoY remains sticky above the Fed's 2% target maintaining hawkish pressure, yet February payrolls printed -92k with a -911k benchmark revision to March 2025 exposing labor market weakness the Fed cannot ignore indefinitely. Treasury yields stubbornly elevated with 30Y at 4.82% and 10Y at 4.28% barely changed from pre-September-cut levels expose the market's profound skepticism. The volatility structure presents critical inflection: MOVE spiking to 91.17—up 22% weekly and 41% monthly from the artificially compressed 60s regime—confirms the mean reversion thesis this desk has maintained, though the -4.3% pullback in 24 hours suggests the panic phase may be moderating.
Historical patterns show MOVE compressions below 65 typically precede 15-20% expansion spikes, implying potential for further climb to 95-105 range creating 1.5-2.5 handle daily ranges versus current 0.5-0.75. Technical breakdown is structurally complete—ZB violated critical 116 support last week falling to 113.72, establishing new bearish regime with former support at 116.5 now serving as formidable resistance. Current price at 114.34 sits in the danger zone between 113.5 immediate support and 115.5 resistance with TradingView showing Strong Sell technical rating.
The regime is HIGHLY UNSTABLE heading into FOMC—bonds face binary path with either dovish surprise triggering short covering rally above 116.5 toward 118-120 zone, or hawkish confirmation sending prices below 113.5 toward 112 major support with cascade potential. Current consolidation at 113.5-115.5 represents calm before potential storm as FOMC forces resolution. Given 43% of ZB weeks move less than 0.5% (the Noise Floor), and absent a catalyst the asset defaults to range-bound behavior, conviction is capped at 5 despite correct bearish call last week.
The FOMC blackout period creates an informational void where no new Fed signals emerge before the meeting, limiting actionable edge. This synthesis reflects TRANSITIONAL macro regime assessment—neither clear risk-on nor risk-off dominates, with conflicting signals (VIX fear yet bonds selling) preventing structural directional advantage.
| Week | Bias | Confidence | Result |
|---|---|---|---|
| March 14, 2026 | BEARISH | 5/10 | ✅ |
| March 6, 2026 | BULLISH | 6/10 | ❌ |
| February 27, 2026 | BULLISH | 6/10 | ✅ |
| February 21, 2026 | BEARISH | 7/10 | ✅ |
| February 13, 2026 | BEARISH | 9/10 | ❌ |
| February 8, 2026 | BEARISH | 9/10 | ✅ |
| February 1, 2026 | NO CALL | 9/10 | ➖ |
| January 25, 2026 | BEARISH | 9/10 | ✅ |
| January 11, 2026 | BEARISH | 9/10 | ✅ |
| January 4, 2026 | BEARISH | 9/10 | ❌ |
| December 28, 2025 | BEARISH | 8/10 | ✅ |
| December 21, 2025 | BEARISH | 9/10 | ❌ |
📋 PROMPT-READY CONTEXT
Copy this entire block into any AI chat for follow-up analysis
▼ Expand
MACRO AGENT DESK — WEEKLY INTELLIGENCE BRIEFING
═════════════════════════════════════════════════
Asset: 30-Year Treasury (ZB)
Report Date: March 15, 2026

── DIRECTIONAL BIAS ─────────────────────────────
Call: BEARISH
Confidence: 5/10
Signal: ▲ VIEW STRENGTHENED FROM LAST WEEK
MAD Index: 28 (MOSTLY ALIGNED)

── MARKET CONTEXT ───────────────────────────────
State: BREAKING DOWN AFTER LAST WEEK'S SELLOFF
Regime: RANGE-BOUND CONSOLIDATION BETWEEN FOMC MEETINGS WITH ELEVATED VOLATILITY
Sentiment: FEAR

── WHAT THE MARKET SEES ─────────────────────────
Market pricing 92% hold at March 18-19 FOMC with only one cut expected for all of 2026; bonds consolidating 112-118 range awaiting FOMC clarity on terminal rate trajectory

── WHAT THE MARKET IS MISSING ───────────────────
Desk identifies structural supply pressure from $1.9T FY2026 deficit with $308B February issuance as underweighted fundamental driver creating persistent bearish undertone independent of Fed path; however FOMC binary risk 3-4 days away creates two-way uncertainty limiting conviction to noise-threshold minimum

── KEY DRIVERS ──────────────────────────────────
1. Violent breakdown from 116 to 113.72 last week confirms post-February rally exhaustion with FOMC blackout period creating informational void ahead of March 18-19 decision
2. MOVE volatility index at 91.17 up 22% weekly and 41% monthly from compressed levels signaling expanding uncertainty despite VIX elevated at 27.85 creating mixed risk signals
3. Fresh fundamental catalyst from CBO March 9 report showing FY2026 deficit at $1.9 trillion with $308B February issuance maintaining structural supply pressure on long duration

── KEY ZONES ────────────────────────────────────
Resistance 2: 116.500 – 117.500
Resistance 1: 115.000 – 116.000
Pivot: ~114.340
Support 1: 113.000 – 114.000
Support 2: 111.500 – 112.500

── DISCIPLINE BIASES ────────────────────────────
Technical: BEARISH
Fundamental: BEARISH
Institutional: NO CALL
Options: NO CALL
Economic: BEARISH
Sentiment: BULLISH

── TECHNICAL STRUCTURE ──────────────────────────
Breakdown structure complete with former 116.5 support now resistance; current price at 114.34 testing mid-range between 113.5 support and 115.5 resistance with Strong Sell technical rating

── FUNDAMENTAL ASSESSMENT ───────────────────────
Fed at 3.50-3.75% with 92% probability of hold at March 18-19 FOMC; FY2026 deficit $1.9T with $308B February issuance creating structural bearish repricing environment for long duration

── INSTITUTIONAL POSITIONING ────────────────────
Defensive deleveraging continues with concerning rotation signals from Treasuries to international bonds per prior weeks though latest COT data unavailable

── OPTIONS FLOW ─────────────────────────────────
MOVE index at 91.17 showing significant elevation from recent 60s compression but pulling back 4.3% in 24 hours suggesting volatility spike moderating ahead of FOMC; ZB options thin with limited directional signal

── ECONOMIC BACKDROP ────────────────────────────
February CPI at 2.5% YoY sticky above 2% target with weak payrolls -92k creating conflicting signals; Fed Chair Powell term ends May 2026 adding leadership uncertainty; PPI due March 18 same day as FOMC

── VOLATILITY REGIME ────────────────────────────
Regime: NORMAL
Percentile: 42nd
Trend: Expanding ▲
Days in Regime: 14
Term Structure: Normal - Short-term vol at 11.8 below medium-term 13.2 as MOVE expands from compressed regime toward normalized levels; expansion accelerating with MOVE at 91.17 up 22% weekly though pulling back 4.3% in 24 hours
Historical Pattern: Current MOVE expansion from 60s lows to 91.17 represents mid-stage of typical mean reversion pattern; historical precedent shows 20-30% spikes within 1-2 weeks following such compressions suggesting potential for further expansion though recent pullback suggests moderation
Outlook: Moderate probability 60-70% of continued expansion within 3-5 trading days as MOVE continues mean reversion from artificial compression toward 95-105 range before March 18-19 FOMC resolution
Trading Context: Volatility expansion creating elevated environment; daily ranges expanding from 0.5 handles to 1.0-1.5 handles with maximum binary risk into March 18-19 FOMC; current 114.34 price in consolidation zone between 113.5-115.5 awaiting catalyst
Vol Risk/Opportunity: Moderate asymmetry with MOVE at 91.17 providing both risk (further expansion to 95-105 creating violent moves) and opportunity (volatility peaks often mark inflection points) but binary FOMC catalyst 3-4 days away dominates all other considerations limiting directional conviction

── PRIMARY RISK ─────────────────────────────────
FOMC on March 18-19 surprises dovish with dot plot showing more cuts than market expects (currently only one in 2026) triggering violent short covering rally above 116.5 resistance toward 118-120 zone invalidating bearish signal
Probability: MEDIUM

── PRIMARY OPPORTUNITY ──────────────────────────
Continued breakdown below 113.5 support on hawkish FOMC rhetoric or strong economic data forcing terminal rate repricing higher with cascade potential to 112 major support representing additional 1.5-2.0% decline opportunity
Timeframe: Next 1-2 weeks through March 18-19 FOMC and immediate post-decision repricing

── NEXT CATALYST ────────────────────────────────
Date: March 19, 2026
Event: FOMC policy decision March 18-19 at 2:00 PM with Powell press conference at 2:30 PM plus updated dot plot - THE dominant catalyst with 92%+ hold probability but forward guidance critical
Expected Impact: HIGH

═════════════════════════════════════════════════
Source: Macro Agent Desk (macroagentdesk.com)
═════════════════════════════════════════════════

── FULL ANALYSIS ────────────────────────────────
ZB Treasury bond futures trade at 114.34 on March 15, 2026, consolidating in the aftermath of last week's violent -1.97% breakdown that vindicated this desk's BEARISH call and extended the post-February rally exhaustion. The asset sits in a critical TRANSITIONAL macro regime—VIX elevated at 27.85 signals broad market fear driving safe-haven demand, yet bonds continue selling off, exposing profound skepticism about Fed easing trajectory despite risk-off conditions. This paradox defines current market structure. The March 18-19 FOMC meeting 3-4 days away dominates all forward analysis with 92%+ probability of hold at 3.50-3.75% already priced, but the updated dot plot and Powell's forward guidance will determine whether the December hawkish pivot (projecting only 2 cuts through 2027 before terminal at 3%) remains intact or moderates. Fresh fundamental catalyst emerged March 9 via CBO report confirming FY2026 deficit trajectory worsening to $1.9 trillion with February alone requiring $308 billion in new issuance—a $142 billion increase versus prior year validating persistent supply pressure that fundamentally reprices long duration lower. The conflicting data environment creates maximum uncertainty: February CPI at 2.5% YoY remains sticky above the Fed's 2% target maintaining hawkish pressure, yet February payrolls printed -92k with a -911k benchmark revision to March 2025 exposing labor market weakness the Fed cannot ignore indefinitely. Treasury yields stubbornly elevated with 30Y at 4.82% and 10Y at 4.28% barely changed from pre-September-cut levels expose the market's profound skepticism. The volatility structure presents critical inflection: MOVE spiking to 91.17—up 22% weekly and 41% monthly from the artificially compressed 60s regime—confirms the mean reversion thesis this desk has maintained, though the -4.3% pullback in 24 hours suggests the panic phase may be moderating. Historical patterns show MOVE compressions below 65 typically precede 15-20% expansion spikes, implying potential for further climb to 95-105 range creating 1.5-2.5 handle daily ranges versus current 0.5-0.75. Technical breakdown is structurally complete—ZB violated critical 116 support last week falling to 113.72, establishing new bearish regime with former support at 116.5 now serving as formidable resistance. Current price at 114.34 sits in the danger zone between 113.5 immediate support and 115.5 resistance with TradingView showing Strong Sell technical rating. The regime is HIGHLY UNSTABLE heading into FOMC—bonds face binary path with either dovish surprise triggering short covering rally above 116.5 toward 118-120 zone, or hawkish confirmation sending prices below 113.5 toward 112 major support with cascade potential. Current consolidation at 113.5-115.5 represents calm before potential storm as FOMC forces resolution. Given 43% of ZB weeks move less than 0.5% (the Noise Floor), and absent a catalyst the asset defaults to range-bound behavior, conviction is capped at 5 despite correct bearish call last week. The FOMC blackout period creates an informational void where no new Fed signals emerge before the meeting, limiting actionable edge. This synthesis reflects TRANSITIONAL macro regime assessment—neither clear risk-on nor risk-off dominates, with conflicting signals (VIX fear yet bonds selling) preventing structural directional advantage.


