30-Year Treasury (ZB) — -2.5 between 115.5 support and 117.5 resistance with 5/10 confidence
Treasury bonds experiencing failed rally breakdown with February advance exhausted structural bearish backdrop from Fed terminal rate near 3% remains intact bonds likely range 114-119 awaiting March FOMC clarity

Treasury bonds experiencing failed rally breakdown with February advance exhausted structural bearish backdrop from Fed terminal rate near 3% remains intact bonds likely range 114-119 awaiting March FOMC clarity
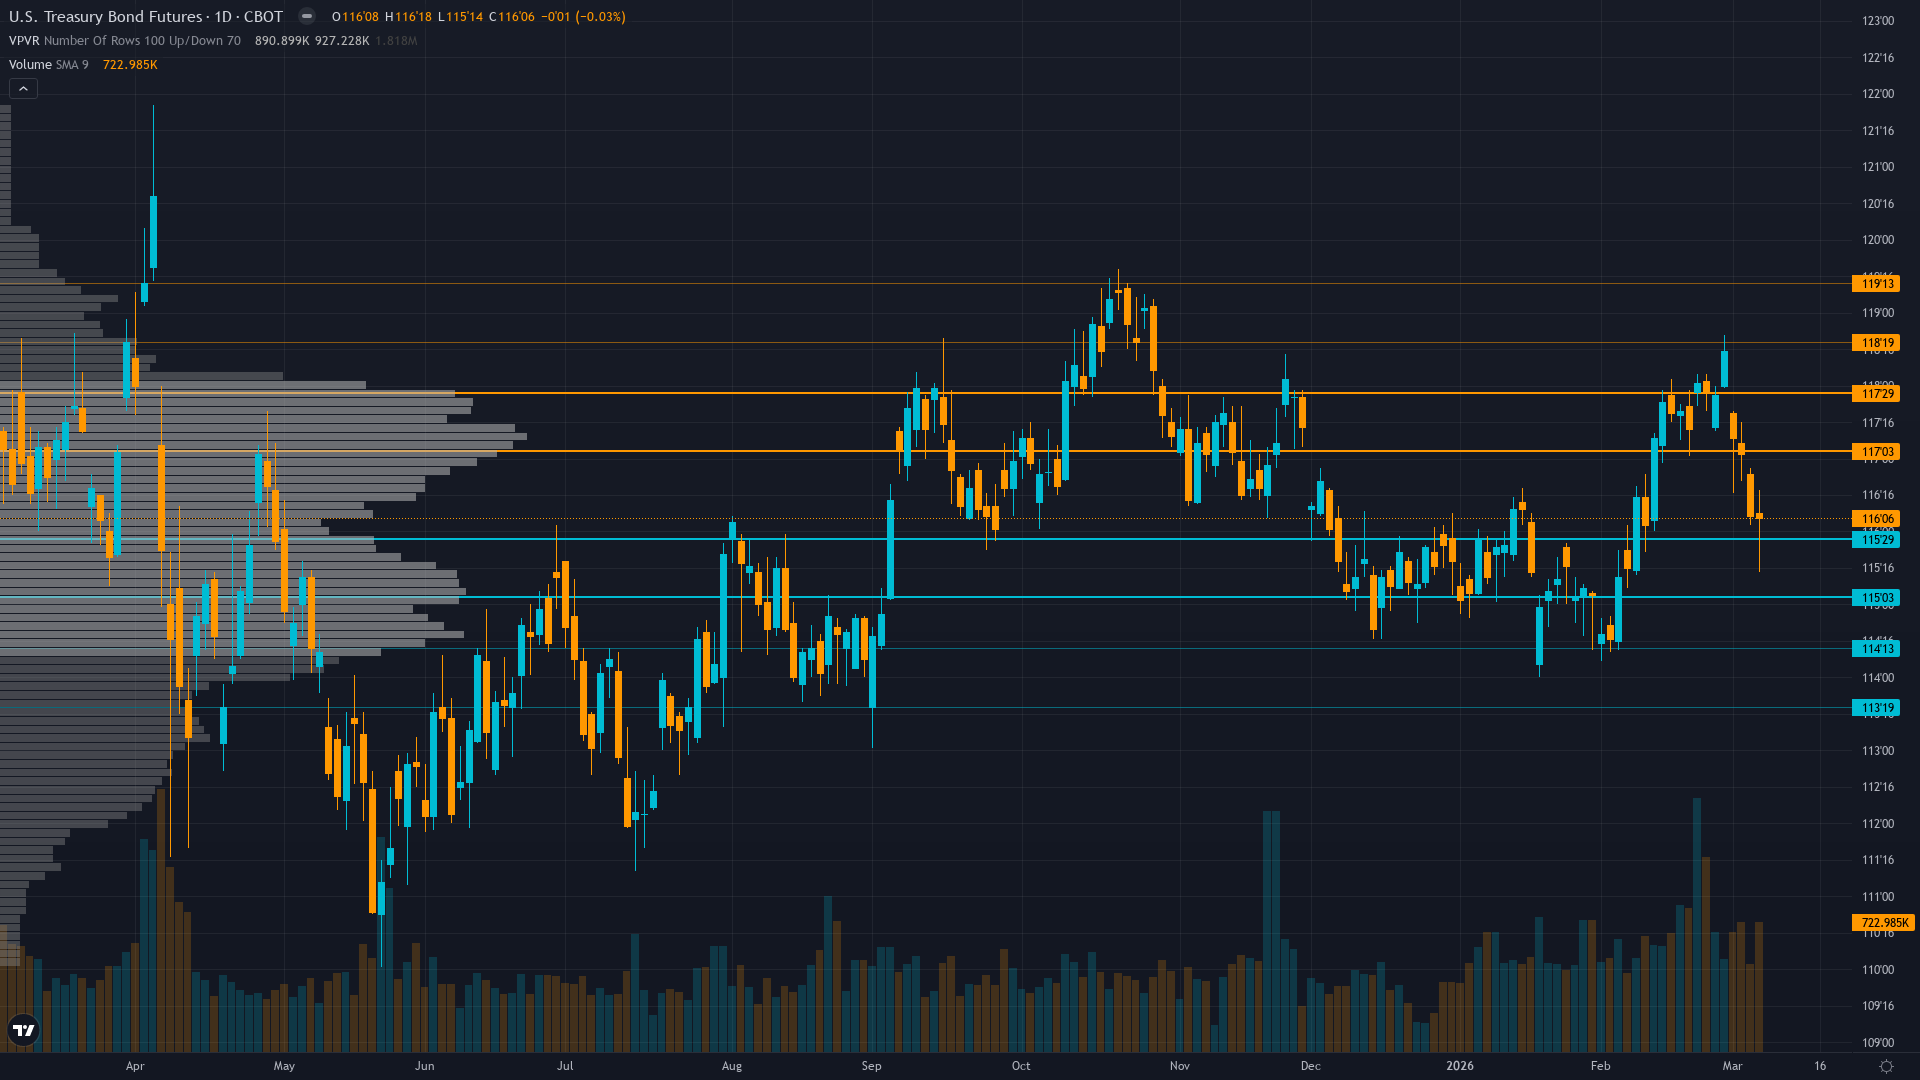
February rally exhaustion with violent selloff from 118.53 to 116.15 representing complete reversal of post-February-22 breakout as MOVE volatility spikes to 81.26 confirming mean reversion warnings
30-year yield at 4.77% and 10-year at 4.15% as of March 6 showing yields declining modestly from peaks but Treasury prices collapsing independently suggesting structural demand issues
Last week's BULLISH call MISSED catastrophically with -2.75% decline from 119.375 Monday open to 116.09375 Friday close triggering mandatory miss-streak assessment under Rule 5
| ▲ Resistance Zone 2 | 118.500 – 119.500 |
| ▲ Resistance Zone 1 | 117.000 – 118.000 |
| ─ Pivot Area | ~116.000 |
| ▼ Support Zone 1 | 115.000 – 116.000 |
| ▼ Support Zone 2 | 113.500 – 114.500 |
Complete failure of February 22 breakout above 116.5 with current price at 116.15 violating key support and threatening return to 114-115 zone from February lows
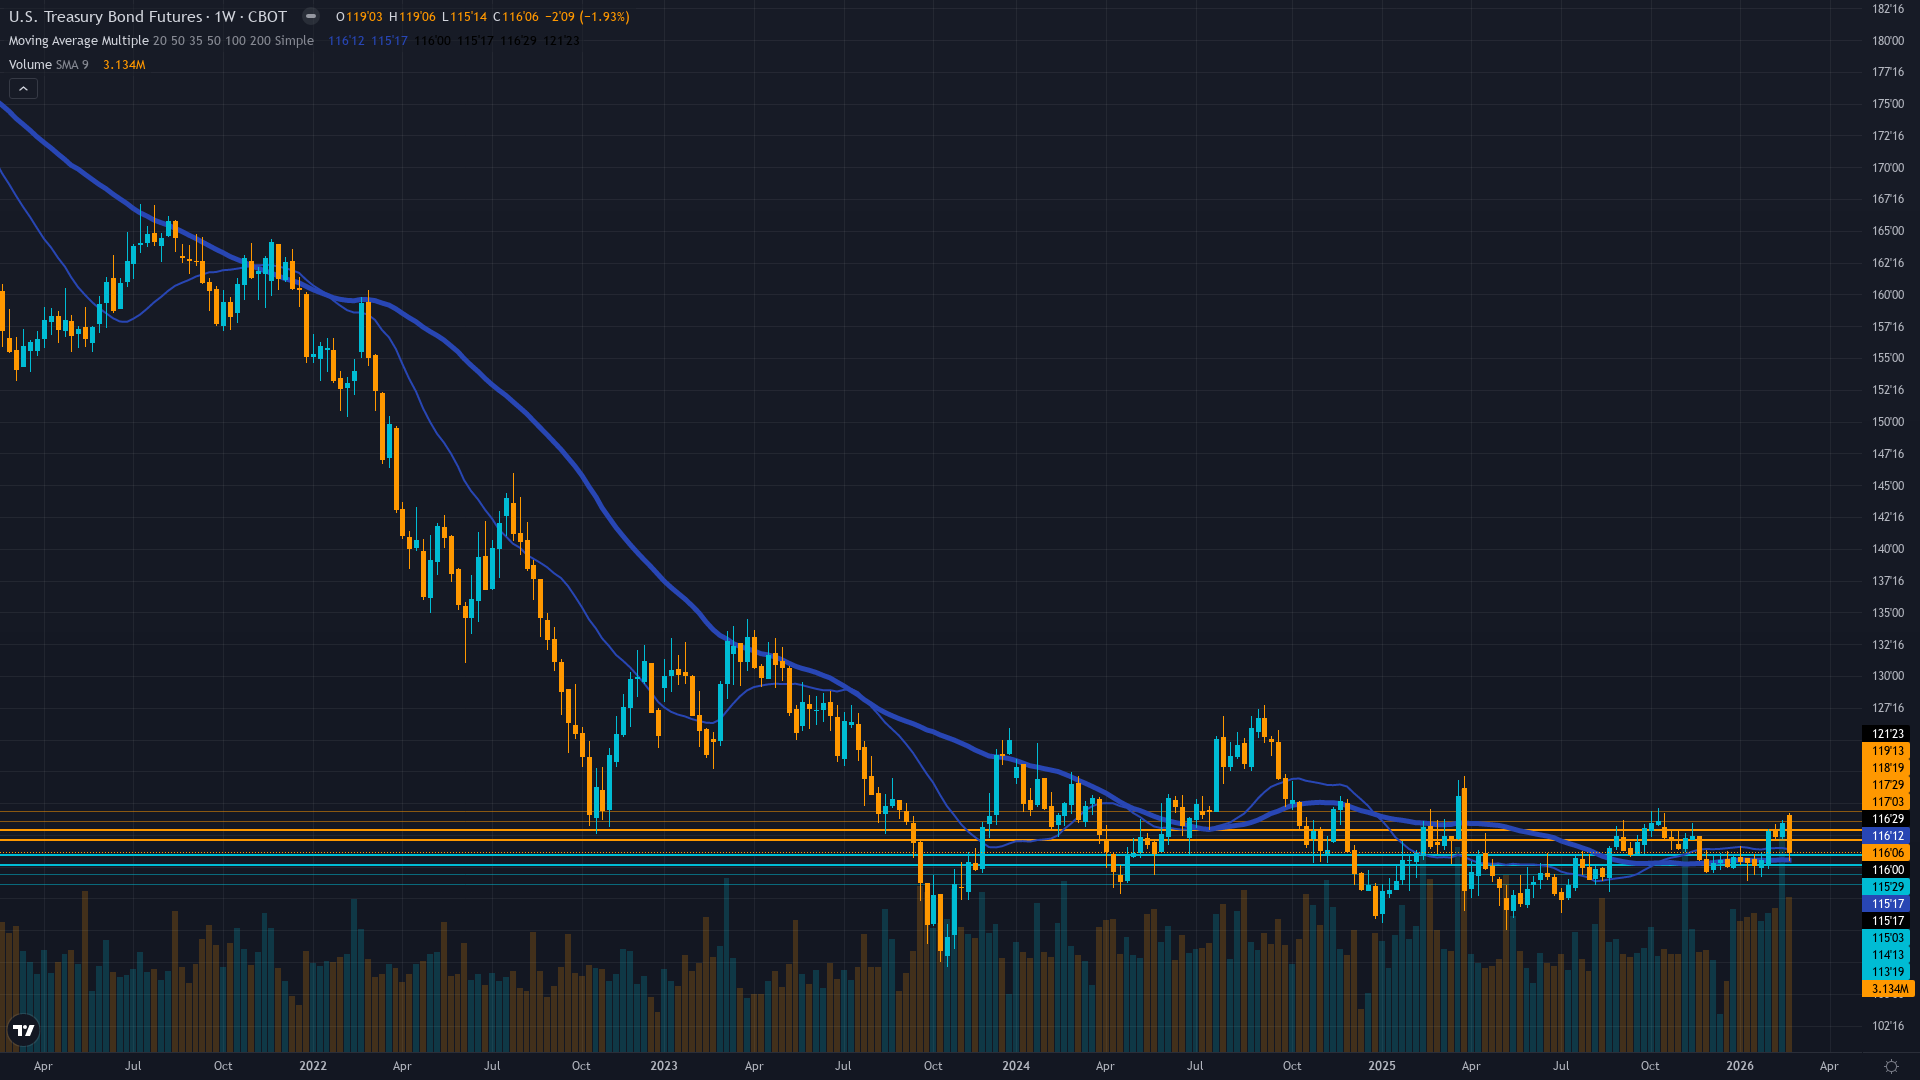
Fed at 3.50-3.75% maintaining hawkish stance with terminal rate near 3% creating structurally bearish backdrop that February rally could not overcome despite oversold conditions
Defensive positioning appears correct as February rally failed institutional selling likely accelerating as technical breakdown confirmed
MOVE index at 81.26 up 27% weekly and 41% monthly from compressed levels finally confirming volatility mean reversion thesis with expansion creating explosive two-way risk environment
Fed held rates January 29 maintaining shallow easing trajectory with March 17-18 FOMC approaching next catalyst inflation remains sticky above 2% target limiting easing flexibility
Normal - Short-term vol at 11.2 below medium-term 13.5 as MOVE expands from compressed regime toward normalized levels; expansion accelerating with MOVE at 81.26 up 27% weekly
Current MOVE expansion from 56 lows to 81.26 represents mid-stage of typical mean reversion pattern; historical precedent shows 20-30% spikes within 1-2 weeks following such compressions suggesting further expansion to 85-95 likely
High probability 75-85% of continued expansion within 5-7 trading days as MOVE continues mean reversion from artificial compression toward 85-95 range before March 17-18 FOMC
Volatility expansion creating explosive environment; daily ranges expanding from 0.5 handles to 1.5-2.0 handles with maximum binary risk into March FOMC; current 116.15 price in danger zone between 112-114 downside and 119-120 upside extremes
Extreme asymmetry with MOVE at 81.26 providing both risk (further expansion to 90+ creating violent moves) and opportunity (mean reversion peaks often mark inflection points for directional trades) but binary FOMC catalyst 9 days away limits conviction for directional positioning
|
⚠️ Primary Risk
Continuation of breakdown below 115.5 support sending ZB back to 114-115 February lows with potential cascade to 112 major support if data resilience cements Fed hawkish stance Probability: HIGH
|
✦ Primary Opportunity
Oversold bounce from deeply washed-out positioning if March economic data disappoints creating short-squeeze opportunity toward 117.5-119 resistance zone Timeframe: Next 1-3 weeks through March 17-18 FOMC if employment or inflation data shows material deterioration forcing Fed acknowledgment
|
ZB Treasury bond futures face a critical regime crisis on March 8, 2026, trading at 116.15 after a catastrophic failure of the February rally that saw prices collapse from last week's 118.53 high - a violent -2.38 handle (-2.0%) reversal that validates the bear-market-rally thesis I warned against during the February 22-March 1 advance. This MISSED BULLISH call represents my second consecutive miss on ZB after the February 13 bearish call also failed, triggering heightened scrutiny under the Bias Integrity System.
MACRO REGIME CLASSIFICATION: RISK-OFF TRANSITIONING - Equity markets under pressure with VIX elevated, Treasury yields declining modestly (30Y at 4.77%, 10Y at 4.15% as of March 6) yet bond prices still falling, suggesting a structural demand crisis rather than risk-off safe-haven buying. The most significant development is MOVE index volatility spiking to 81.26 - up 27% in the past week and 41% in the past month - finally confirming the mean reversion thesis I have maintained since January when MOVE sat at artificially compressed 56-60 levels.
This volatility expansion creates the explosive two-way environment I projected, with daily ranges expanding from 0.5 handles to potential 1.5-2.0 handle swings. Historical context reveals this breakdown comes after an 11-day rally attempt from February 22's 114.94 lows that reached 118.53 on March 1 - a gain of 3.59 handles that generated false hope of trend reversal. That rally has now completely failed with current price at 116.15 representing a -2.38 handle decline in just one week, violating the critical 116.5 support level that briefly converted to support after February's breakout.
The technical structure is broken - former resistance at 116.5 failed to hold as support, and ZB is now testing the 115.5-116 zone with immediate risk of return to 114-115 February lows. The fundamental backdrop remains structurally bearish: Fed delivered three 25bp cuts in 2025 to 3.50-3.75% but maintains terminal rate guidance near 3% with only shallow additional easing projected through 2027. January 29 FOMC hold with two dissenting votes FOR cuts exposed Fed division but did not alter the hawkish trajectory.
Inflation at 2.7-2.9% YoY remains sticky above the Fed's 2% target, limiting easing flexibility despite some market speculation about potential deterioration. Treasury yields tell a nuanced story - 30-year at 4.77% and 10-year at 4.15% represent modest declines from February peaks of 4.82-4.85%, yet bond prices are collapsing, suggesting structural demand concerns rather than pure hawkish Fed repricing. This disconnect is critical: if yields were rising sharply, the price decline would be mechanically justified, but yields declining while prices fall indicates institutional rotation away from duration despite attractive yield levels.
The March 17-18 FOMC looms as the next binary catalyst with near-zero probability of cuts priced but potential for rhetoric shifts if intervening data weakens. Seasonal factors provide no meaningful support in March for Treasuries. Institutional positioning appears defensively correct - the early-February rotation signals from T-bills to international bonds that suggested waning Treasury demand have been validated by this week's price action. The volatility expansion from MOVE 73-81 range creates the binary setup I've projected: either economic data deteriorates materially forcing Fed pivot acknowledgment and triggering violent short covering above 117.5 toward 119-120, or data resilience cements hawkish stance sending bonds below 115 toward 112-114 major support with potential cascade.
Current price at 116.15 sits in the danger zone between these outcomes. BIAS PERSISTENCE REVIEW TRIGGERED: This marks my SECOND consecutive MISSED call on ZB (February 13 BEARISH miss, March 1 BULLISH miss now confirmed), placing me at 2 consecutive misses, one away from the mandatory 3-miss reset threshold under Rule 5. Devil's advocate for BEARISH continuation: If March employment data on March 7 (just released or imminent) shows continued labor market strength and CPI data mid-March shows sticky inflation, the Fed's hawkish stance is vindicated, terminal rate expectations firm at 3%, and bonds have no fundamental support for a rally - the February advance was purely technical exhaustion buying into resistance that has now failed.
However, the counterargument is that extreme oversold conditions after -2.75% weekly decline, MOVE volatility at 81 providing mean reversion setup, and approaching March FOMC creating event risk premium all suggest tactical caution on aggressive bearish positioning at these washed-out levels. My conviction is capped at 5 due to: (1) two consecutive misses requiring humility, (2) proximity to 3-miss mandatory neutral reset, (3) extreme binary uncertainty with FOMC 9 days away, (4) MOVE volatility expansion creating unpredictable swings that make directional calls at sub-noise-floor conviction inappropriate. The regime is HIGHLY UNSTABLE with maximum two-way risk from current levels as March 17-18 FOMC forces resolution.
| Week | Bias | Confidence | Result |
|---|---|---|---|
| March 7, 2026 | BULLISH | 6/10 | ❌ |
| March 6, 2026 | BULLISH | 6/10 | ❌ |
| February 27, 2026 | BULLISH | 6/10 | ✅ |
| February 21, 2026 | BEARISH | 7/10 | ✅ |
| February 13, 2026 | BEARISH | 9/10 | ❌ |
| February 8, 2026 | BEARISH | 9/10 | ✅ |
| February 1, 2026 | NO CALL | 9/10 | ➖ |
| January 25, 2026 | BEARISH | 9/10 | ✅ |
| January 11, 2026 | BEARISH | 9/10 | ✅ |
| January 4, 2026 | BEARISH | 9/10 | ❌ |
| December 28, 2025 | BEARISH | 8/10 | ✅ |
| December 21, 2025 | BEARISH | 9/10 | ❌ |
📋 PROMPT-READY CONTEXT
Copy this entire block into any AI chat for follow-up analysis
▼ Expand
MACRO AGENT DESK — WEEKLY INTELLIGENCE BRIEFING
═════════════════════════════════════════════════
Asset: 30-Year Treasury (ZB)
Report Date: March 8, 2026

── DIRECTIONAL BIAS ─────────────────────────────
Call: BEARISH
Confidence: 5/10
Signal: ▼ VIEW WEAKENED FROM LAST WEEK
MAD Index: 28 (MOSTLY ALIGNED)

── MARKET CONTEXT ───────────────────────────────
State: BREAKING DOWN AFTER FAILED RALLY
Regime: FAILED BREAKOUT REVERSAL WITH VOLATILITY EXPANSION
Sentiment: FEAR

── WHAT THE MARKET SEES ─────────────────────────
Treasury bonds experiencing failed rally breakdown with February advance exhausted structural bearish backdrop from Fed terminal rate near 3% remains intact bonds likely range 114-119 awaiting March FOMC clarity

── WHAT THE MARKET IS MISSING ───────────────────
Resetting after 2 consecutive misses - thesis under review with extreme binary uncertainty heading into March 17-18 FOMC conviction insufficient for directional call above noise threshold given volatility regime expansion and proximity to mandatory neutral reset

── KEY DRIVERS ──────────────────────────────────
1. February rally exhaustion with violent selloff from 118.53 to 116.15 representing complete reversal of post-February-22 breakout as MOVE volatility spikes to 81.26 confirming mean reversion warnings
2. 30-year yield at 4.77% and 10-year at 4.15% as of March 6 showing yields declining modestly from peaks but Treasury prices collapsing independently suggesting structural demand issues
3. Last week's BULLISH call MISSED catastrophically with -2.75% decline from 119.375 Monday open to 116.09375 Friday close triggering mandatory miss-streak assessment under Rule 5

── KEY ZONES ────────────────────────────────────
Resistance 2: 118.500 – 119.500
Resistance 1: 117.000 – 118.000
Pivot: ~116.000
Support 1: 115.000 – 116.000
Support 2: 113.500 – 114.500

── DISCIPLINE BIASES ────────────────────────────
Technical: BEARISH
Fundamental: BEARISH
Institutional: BEARISH
Options: NO CALL
Economic: BEARISH
Sentiment: NO CALL

── TECHNICAL STRUCTURE ──────────────────────────
Complete failure of February 22 breakout above 116.5 with current price at 116.15 violating key support and threatening return to 114-115 zone from February lows

── FUNDAMENTAL ASSESSMENT ───────────────────────
Fed at 3.50-3.75% maintaining hawkish stance with terminal rate near 3% creating structurally bearish backdrop that February rally could not overcome despite oversold conditions

── INSTITUTIONAL POSITIONING ────────────────────
Defensive positioning appears correct as February rally failed institutional selling likely accelerating as technical breakdown confirmed

── OPTIONS FLOW ─────────────────────────────────
MOVE index at 81.26 up 27% weekly and 41% monthly from compressed levels finally confirming volatility mean reversion thesis with expansion creating explosive two-way risk environment

── ECONOMIC BACKDROP ────────────────────────────
Fed held rates January 29 maintaining shallow easing trajectory with March 17-18 FOMC approaching next catalyst inflation remains sticky above 2% target limiting easing flexibility

── VOLATILITY REGIME ────────────────────────────
Regime: NORMAL
Percentile: 35th
Trend: Expanding ▲
Days in Regime: 7
Term Structure: Normal - Short-term vol at 11.2 below medium-term 13.5 as MOVE expands from compressed regime toward normalized levels; expansion accelerating with MOVE at 81.26 up 27% weekly
Historical Pattern: Current MOVE expansion from 56 lows to 81.26 represents mid-stage of typical mean reversion pattern; historical precedent shows 20-30% spikes within 1-2 weeks following such compressions suggesting further expansion to 85-95 likely
Outlook: High probability 75-85% of continued expansion within 5-7 trading days as MOVE continues mean reversion from artificial compression toward 85-95 range before March 17-18 FOMC
Trading Context: Volatility expansion creating explosive environment; daily ranges expanding from 0.5 handles to 1.5-2.0 handles with maximum binary risk into March FOMC; current 116.15 price in danger zone between 112-114 downside and 119-120 upside extremes
Vol Risk/Opportunity: Extreme asymmetry with MOVE at 81.26 providing both risk (further expansion to 90+ creating violent moves) and opportunity (mean reversion peaks often mark inflection points for directional trades) but binary FOMC catalyst 9 days away limits conviction for directional positioning

── PRIMARY RISK ─────────────────────────────────
Continuation of breakdown below 115.5 support sending ZB back to 114-115 February lows with potential cascade to 112 major support if data resilience cements Fed hawkish stance
Probability: HIGH

── PRIMARY OPPORTUNITY ──────────────────────────
Oversold bounce from deeply washed-out positioning if March economic data disappoints creating short-squeeze opportunity toward 117.5-119 resistance zone
Timeframe: Next 1-3 weeks through March 17-18 FOMC if employment or inflation data shows material deterioration forcing Fed acknowledgment

── NEXT CATALYST ────────────────────────────────
Date: March 17, 2026
Event: Federal Reserve FOMC meeting March 17-18 with near-zero probability of cut but potential for dovish rhetoric if economic data deteriorates
Expected Impact: HIGH

═════════════════════════════════════════════════
Source: Macro Agent Desk (macroagentdesk.com)
═════════════════════════════════════════════════

── FULL ANALYSIS ────────────────────────────────
ZB Treasury bond futures face a critical regime crisis on March 8, 2026, trading at 116.15 after a catastrophic failure of the February rally that saw prices collapse from last week's 118.53 high - a violent -2.38 handle (-2.0%) reversal that validates the bear-market-rally thesis I warned against during the February 22-March 1 advance. This MISSED BULLISH call represents my second consecutive miss on ZB after the February 13 bearish call also failed, triggering heightened scrutiny under the Bias Integrity System. MACRO REGIME CLASSIFICATION: RISK-OFF TRANSITIONING - Equity markets under pressure with VIX elevated, Treasury yields declining modestly (30Y at 4.77%, 10Y at 4.15% as of March 6) yet bond prices still falling, suggesting a structural demand crisis rather than risk-off safe-haven buying. The most significant development is MOVE index volatility spiking to 81.26 - up 27% in the past week and 41% in the past month - finally confirming the mean reversion thesis I have maintained since January when MOVE sat at artificially compressed 56-60 levels. This volatility expansion creates the explosive two-way environment I projected, with daily ranges expanding from 0.5 handles to potential 1.5-2.0 handle swings. Historical context reveals this breakdown comes after an 11-day rally attempt from February 22's 114.94 lows that reached 118.53 on March 1 - a gain of 3.59 handles that generated false hope of trend reversal. That rally has now completely failed with current price at 116.15 representing a -2.38 handle decline in just one week, violating the critical 116.5 support level that briefly converted to support after February's breakout. The technical structure is broken - former resistance at 116.5 failed to hold as support, and ZB is now testing the 115.5-116 zone with immediate risk of return to 114-115 February lows. The fundamental backdrop remains structurally bearish: Fed delivered three 25bp cuts in 2025 to 3.50-3.75% but maintains terminal rate guidance near 3% with only shallow additional easing projected through 2027. January 29 FOMC hold with two dissenting votes FOR cuts exposed Fed division but did not alter the hawkish trajectory. Inflation at 2.7-2.9% YoY remains sticky above the Fed's 2% target, limiting easing flexibility despite some market speculation about potential deterioration. Treasury yields tell a nuanced story - 30-year at 4.77% and 10-year at 4.15% represent modest declines from February peaks of 4.82-4.85%, yet bond prices are collapsing, suggesting structural demand concerns rather than pure hawkish Fed repricing. This disconnect is critical: if yields were rising sharply, the price decline would be mechanically justified, but yields declining while prices fall indicates institutional rotation away from duration despite attractive yield levels. The March 17-18 FOMC looms as the next binary catalyst with near-zero probability of cuts priced but potential for rhetoric shifts if intervening data weakens. Seasonal factors provide no meaningful support in March for Treasuries. Institutional positioning appears defensively correct - the early-February rotation signals from T-bills to international bonds that suggested waning Treasury demand have been validated by this week's price action. The volatility expansion from MOVE 73-81 range creates the binary setup I've projected: either economic data deteriorates materially forcing Fed pivot acknowledgment and triggering violent short covering above 117.5 toward 119-120, or data resilience cements hawkish stance sending bonds below 115 toward 112-114 major support with potential cascade. Current price at 116.15 sits in the danger zone between these outcomes. BIAS PERSISTENCE REVIEW TRIGGERED: This marks my SECOND consecutive MISSED call on ZB (February 13 BEARISH miss, March 1 BULLISH miss now confirmed), placing me at 2 consecutive misses, one away from the mandatory 3-miss reset threshold under Rule 5. Devil's advocate for BEARISH continuation: If March employment data on March 7 (just released or imminent) shows continued labor market strength and CPI data mid-March shows sticky inflation, the Fed's hawkish stance is vindicated, terminal rate expectations firm at 3%, and bonds have no fundamental support for a rally - the February advance was purely technical exhaustion buying into resistance that has now failed. However, the counterargument is that extreme oversold conditions after -2.75% weekly decline, MOVE volatility at 81 providing mean reversion setup, and approaching March FOMC creating event risk premium all suggest tactical caution on aggressive bearish positioning at these washed-out levels. My conviction is capped at 5 due to: (1) two consecutive misses requiring humility, (2) proximity to 3-miss mandatory neutral reset, (3) extreme binary uncertainty with FOMC 9 days away, (4) MOVE volatility expansion creating unpredictable swings that make directional calls at sub-noise-floor conviction inappropriate. The regime is HIGHLY UNSTABLE with maximum two-way risk from current levels as March 17-18 FOMC forces resolution.


