30-Year Treasury (ZB) — Market significantly underpricing potential for continued rally toward…
Treasury bonds experiencing technical relief rally after December panic exhaustion but fundamentals remain challenged with Fed terminal rate near 3% and sticky inflation limiting sustained duration rally potential

Treasury bonds experiencing technical relief rally after December panic exhaustion but fundamentals remain challenged with Fed terminal rate near 3% and sticky inflation limiting sustained duration rally potential
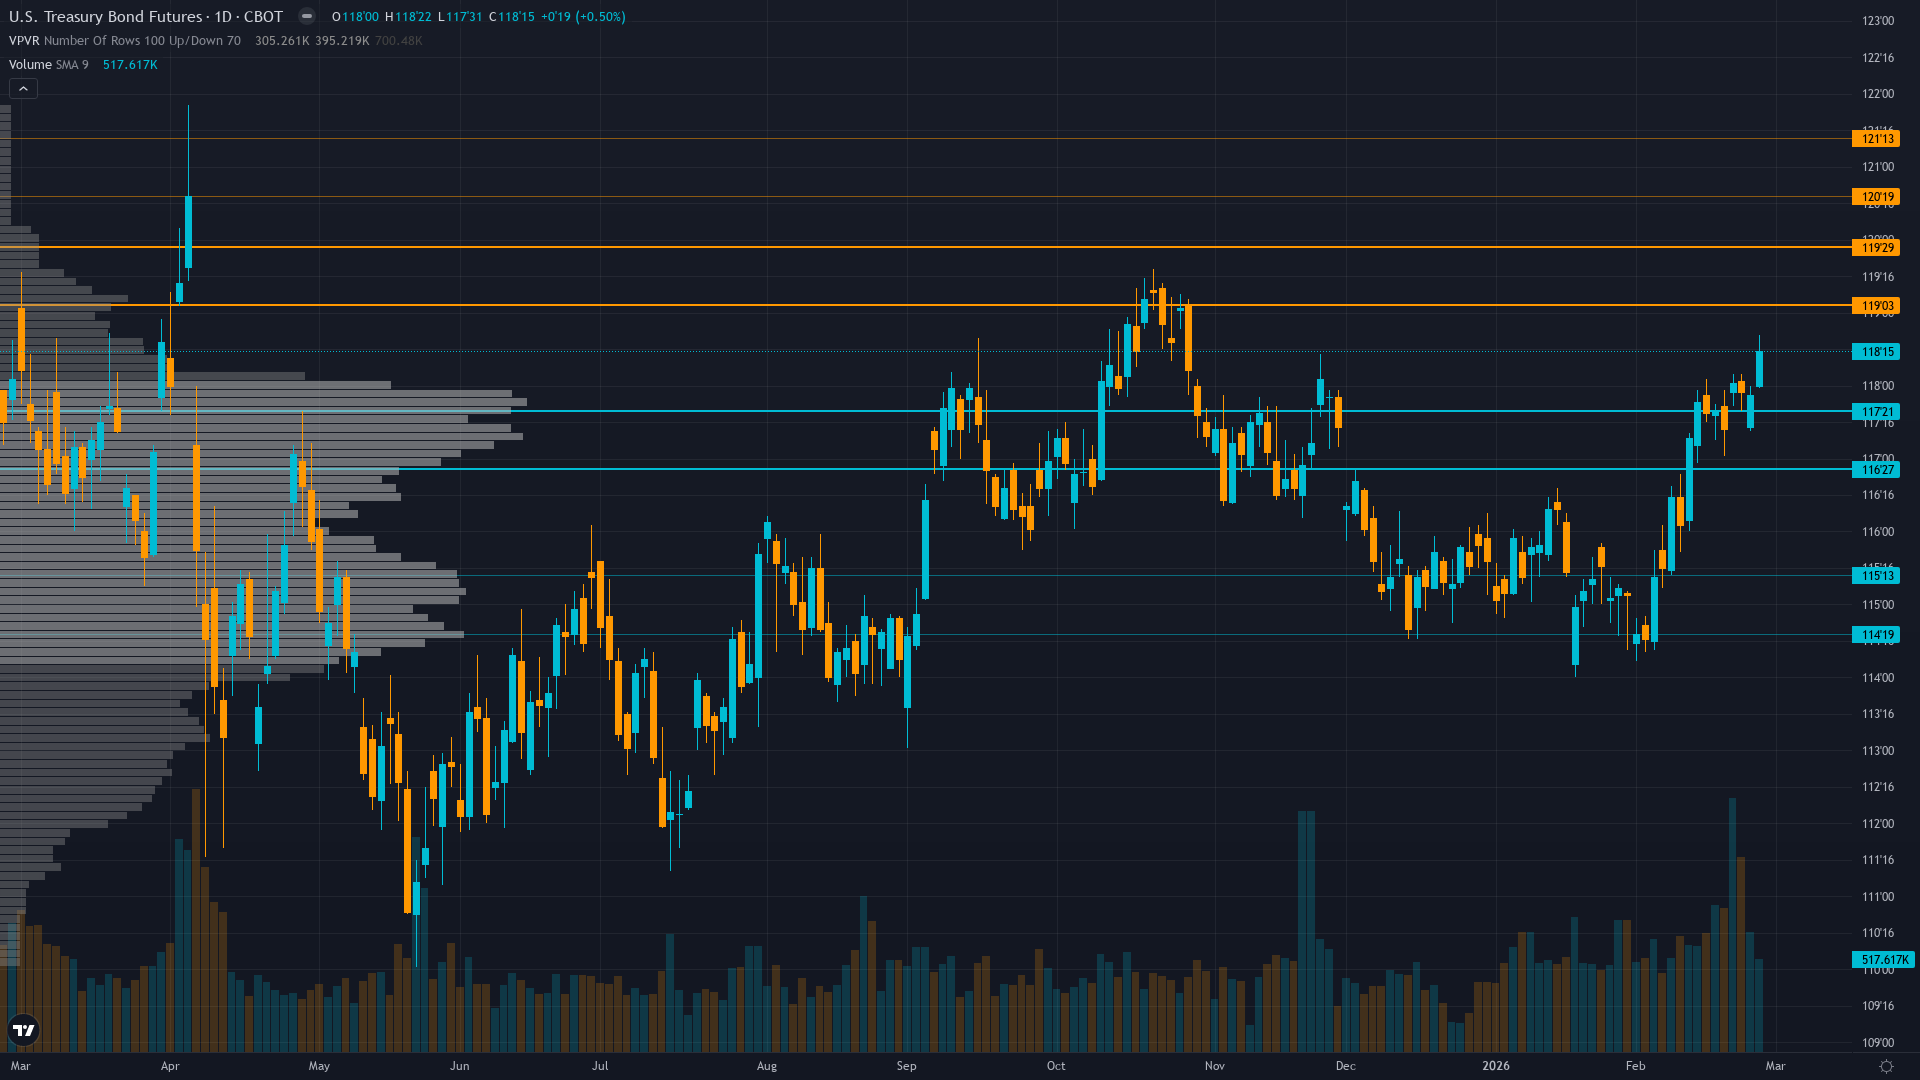
Technical breakout above 116.5 resistance confirms exhaustion of December post-hawkish-Fed panic selling with weekly rally extending bullish momentum
MOVE index volatility compression to 73.4 from 70.1 peak signals reduced panic but artificial calm masking structural uncertainty ahead of March 17-18 FOMC
Market positioning shifting cautiously constructive after February 22nd technical breakout forcing short covering from deeply oversold levels post-$1,300 December losses
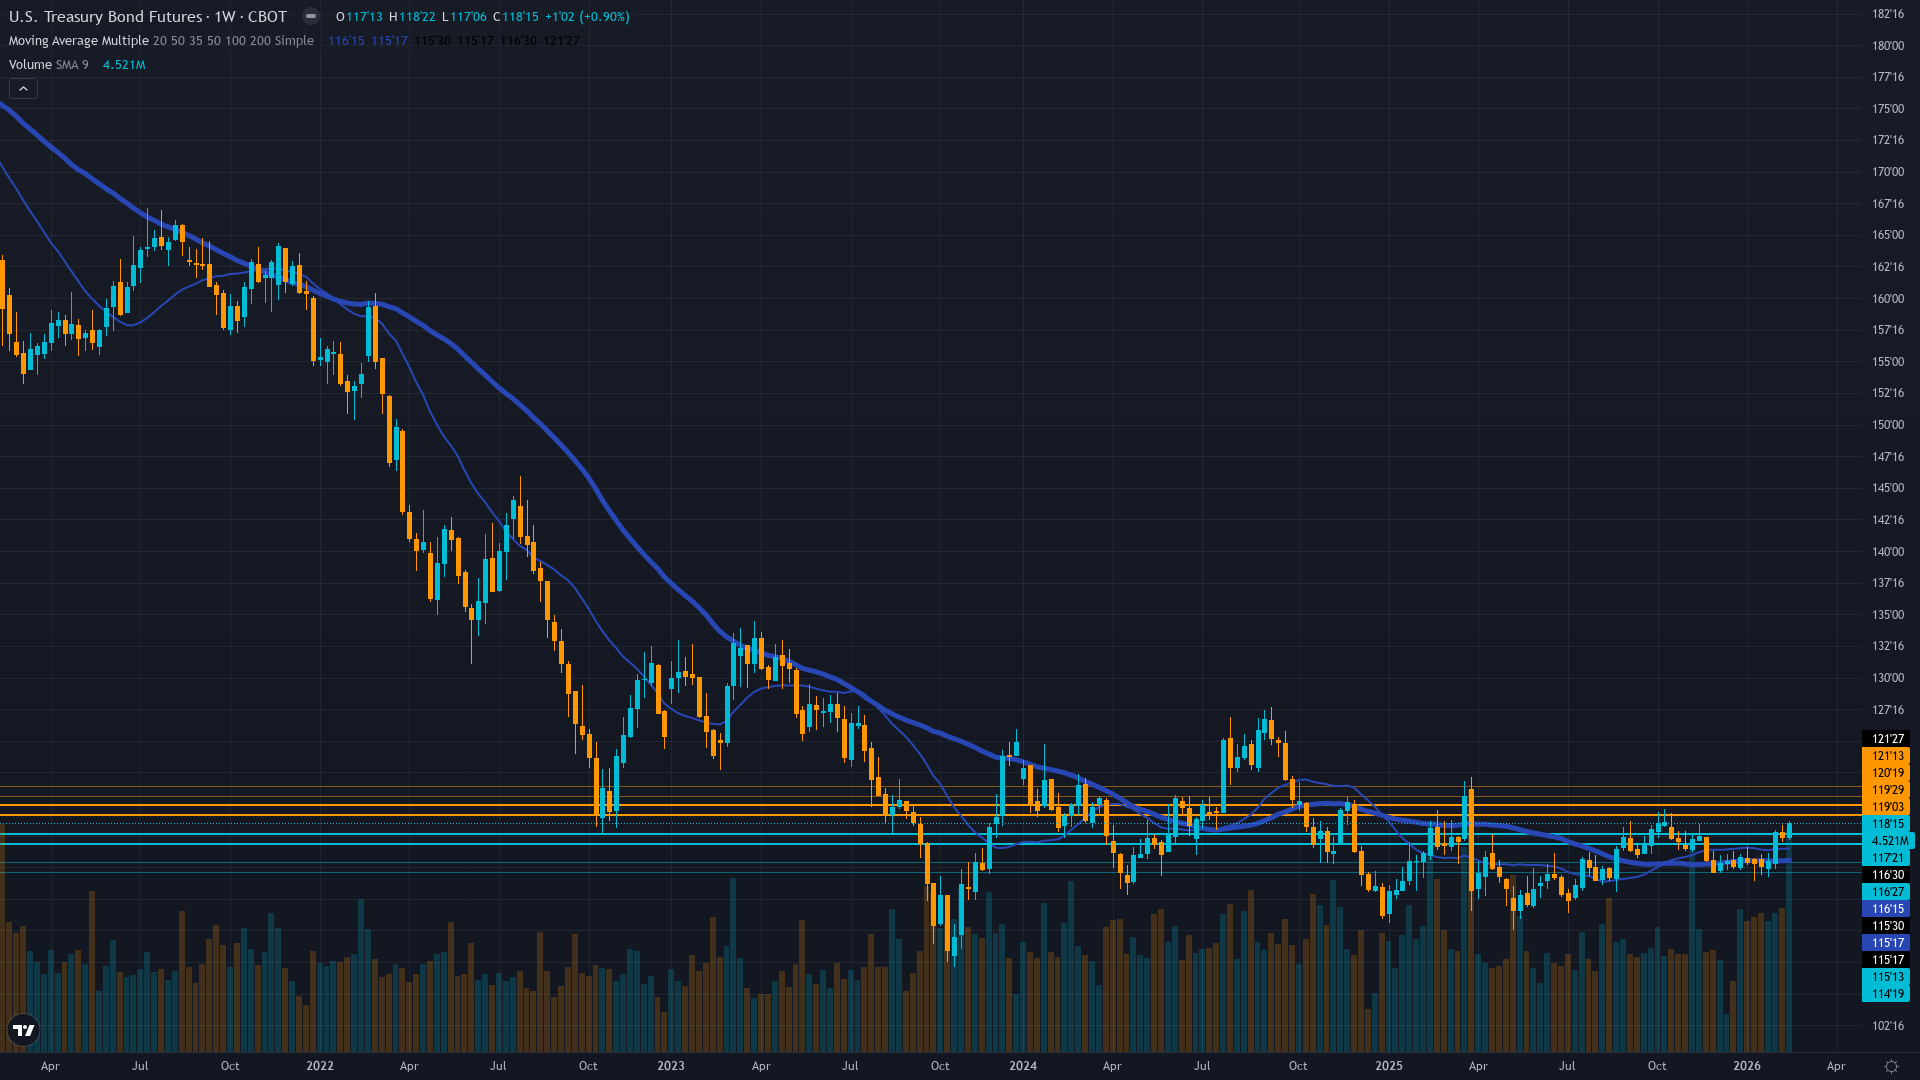
| ▲ Resistance Zone 2 | 120.500 – 121.500 |
| ▲ Resistance Zone 1 | 119.000 – 120.000 |
| ─ Pivot Area | ~118.250 |
| ▼ Support Zone 1 | 116.750 – 117.750 |
| ▼ Support Zone 2 | 114.500 – 115.500 |
Decisive breakout above 116.5 resistance that capped rallies for 7 weeks; rally from 114.90 to 118.53 in one week represents strongest momentum since pre-December levels with former resistance now support
Fed at 3.50-3.75% after three 2025 cuts but hawkish 2026-27 guidance maintains terminal rate near 3% creating structurally bearish backdrop; however market has fully priced this creating asymmetric upside if data softens
Cautiously adding duration exposure following technical breakout but defensive positioning persists awaiting March FOMC clarity on 2026 easing trajectory
MOVE at 73.4 down from 70.1 peak signals reduced panic but remains in artificially compressed regime below historical median creating mean reversion setup with 15-20% expansion potential
Fed held rates January 29 at 3.50-3.75% with two dissenting votes for cuts; inflation at 2.4% YoY sticky above target but showing moderation; March 17-18 FOMC next catalyst with near-zero cut probability priced
Inverted - Short-term volatility at 10.5 compressed below medium-term 12.8 and long-term 14.3 reflecting artificially calm surface despite technical breakout; MOVE at 73.4 down from peaks suggests volatility compression continuing
Similar MOVE compressions below 75 during prior Fed pivot periods in 2018-19 preceded 15-20% volatility expansion spikes within 1-2 weeks as markets repriced; current 28-day low volatility regime approaching historical average duration of 30-35 days before mean reversion
Moderate probability 55-65% of volatility expansion within 7-10 trading days as March FOMC approaches and technical breakout either confirms or fails; MOVE likely to expand toward 80-90 range from current 73.4 creating 10-20% spike potential
Artificially calm surface with MOVE at 73.4 and declining daily ranges masks structural uncertainty from technical breakout; expect daily ranges to expand from current 0.40-0.50 handles to 0.80-1.20 handles as March FOMC approaches and breakout either confirms or fails creating violent moves in either direction
Moderate asymmetry emerging as volatility compression creates false sense of stability while technical breakout increases binary risk; limited downside from current 73.4 MOVE given below-median readings but substantial upside to 80-90 range representing 10-23% expansion potential creating opportunity for volatility plays ahead of March FOMC
|
⚠️ Primary Risk
Bear market rally exhausts near 119-120 resistance with renewed selling if February economic data shows resilient growth and sticky inflation forcing market to reprice Fed terminal rate higher sending bonds back below 116.5 Probability: MEDIUM
|
✦ Primary Opportunity
Duration rally extends toward 120-122 zone if economic data deteriorates materially through February or Fed officials moderate hawkish rhetoric ahead of March FOMC forcing short covering from oversold positioning after $1,300 December losses Timeframe: Next 2-4 weeks through March 17-18 FOMC as February employment and inflation data releases provide easing justification and technical momentum carries through former resistance
|
ZB Treasury bond futures face a critical regime inflection on March 1, 2026, trading at 118.53 after breaking decisively above 116.5 resistance that capped moves for seven consecutive weeks following the catastrophic December 10 hawkish Fed pivot. Last week's CORRECT bullish call at 117.41 captured the initial breakout rally that has now extended to 118.53, gaining 0.96% (approximately $300 per contract) as momentum builds. This represents the strongest technical structure since pre-December levels and signals potential exhaustion of the panic selling that saw ZB lose over $1,300 per contract from 120+ levels.
Historical context reveals this breakout comes after 11 weeks of post-hawkish repricing that followed the Fed's December dot plot showing only ONE additional cut in 2026 before terminal rate at 3%. The January 29 FOMC hold confirmed the shallow easing trajectory, yet Treasury yields have begun moderating—30-year at 4.64% (down from 4.82% peaks) and 10-year at 3.97%—suggesting the market is pricing reduced hawkish risk while maintaining defensive positioning. The MOVE index at 73.4 shows volatility compression from the 70.1 peak but remains elevated enough to signal potential mean reversion expansion ahead of the March 17-18 FOMC.
The technical breakout above 116.5 is significant because it represents the first decisive violation of resistance since the December collapse, with former resistance now serving as support. Institutional positioning appears cautiously constructive with gradual duration extension following the breakout, though rotation signals from T-bills to international bonds earlier in February suggest waning Treasury demand that could limit rally potential. February seasonality provides neutral-to-slightly-positive tailwinds as institutional positioning shifts into Q1, though the post-hawkish repricing regime dominates all seasonal tendencies.
The key tension is whether this represents a sustainable trend reversal or a bear market rally into resistance before resumption of the bearish trajectory driven by Fed terminal rate expectations near 3%. The regime is highly transitional—bonds face a binary path with either continued rally toward 119.5-121.0 if February data softens justifying duration extension, or exhaustion near current resistance if employment and CPI data show resilience cementing hawkish Fed stance. Current price at 118.53 represents a 3.12-handle recovery from mid-February lows but remains 2.53 handles (2.1%) below the pre-December-FOMC levels above 121, suggesting substantial upside potential if the technical breakout confirms trend reversal.
With the March FOMC approaching and inflation data releases imminent through February, the market appears to be pricing moderate optimism about reduced Fed hawkishness while maintaining defensive positioning. The one-week rally from last Saturday's call at 117.41 to current 118.53 validates the bullish thesis that December panic exhaustion created asymmetric upside opportunity, though conviction remains capped at 6 given the structural bearish backdrop from Fed terminal rate guidance and the risk this is a technical bounce rather than fundamental regime change.
| Week | Bias | Confidence | Result |
|---|---|---|---|
| February 27, 2026 | BULLISH | 6/10 | ✅ |
| February 21, 2026 | BEARISH | 7/10 | ✅ |
| February 13, 2026 | BEARISH | 9/10 | ❌ |
| February 8, 2026 | BEARISH | 9/10 | ✅ |
| February 1, 2026 | BEARISH | 9/10 | ❌ |
| January 25, 2026 | BEARISH | 9/10 | ✅ |
| January 11, 2026 | BEARISH | 9/10 | ✅ |
| January 4, 2026 | BEARISH | 9/10 | ❌ |
| December 28, 2025 | BEARISH | 8/10 | ✅ |
| December 21, 2025 | BEARISH | 9/10 | ❌ |
| December 14, 2025 | BEARISH | 9/10 | ❌ |
| December 7, 2025 | NO CALL | 6/10 | ➖ |
📋 PROMPT-READY CONTEXT
Copy this entire block into any AI chat for follow-up analysis
▼ Expand
MACRO AGENT DESK — WEEKLY INTELLIGENCE BRIEFING
═════════════════════════════════════════════════
Asset: 30-Year Treasury (ZB)
Report Date: March 1, 2026

── DIRECTIONAL BIAS ─────────────────────────────
Call: NO CALL
Confidence: 6/10
Signal: VIEW MAINTAINED FROM LAST WEEK
MAD Index: 42 (SLIGHT DIVERGENCE)

── MARKET CONTEXT ───────────────────────────────
State: BREAKING OUT FROM POST-DECEMBER CONSOLIDATION
Regime: POST-HAWKISH FED RECOVERY ATTEMPTING TO ESTABLISH NEW RANGE AFTER DECEMBER BREAKDOWN WITH TECHNICAL MOMENTUM IMPROVING
Sentiment: NEUTRAL TRANSITIONING FROM FEAR

── WHAT THE MARKET SEES ─────────────────────────
Treasury bonds experiencing technical relief rally after December panic exhaustion but fundamentals remain challenged with Fed terminal rate near 3% and sticky inflation limiting sustained duration rally potential

── WHAT THE MARKET IS MISSING ───────────────────
Market significantly underpricing potential for continued rally toward 119.5-121 if February economic data disappoints given extreme oversold positioning after $1,300 December losses and technical breakout above 116.5 resistance forcing short covering; alternatively market may be overestimating rally sustainability with yields stubbornly elevated and Fed hawkish guidance unchanged creating bear trap risk

── KEY DRIVERS ──────────────────────────────────
1. Technical breakout above 116.5 resistance confirms exhaustion of December post-hawkish-Fed panic selling with weekly rally extending bullish momentum
2. MOVE index volatility compression to 73.4 from 70.1 peak signals reduced panic but artificial calm masking structural uncertainty ahead of March 17-18 FOMC
3. Market positioning shifting cautiously constructive after February 22nd technical breakout forcing short covering from deeply oversold levels post-$1,300 December losses

── KEY ZONES ────────────────────────────────────
Resistance 2: 120.500 – 121.500
Resistance 1: 119.000 – 120.000
Pivot: ~118.250
Support 1: 116.750 – 117.750
Support 2: 114.500 – 115.500

── DISCIPLINE BIASES ────────────────────────────
Technical: BULLISH
Fundamental: NO CALL
Institutional: BULLISH
Options: NO CALL
Economic: BEARISH
Sentiment: NO CALL

── TECHNICAL STRUCTURE ──────────────────────────
Decisive breakout above 116.5 resistance that capped rallies for 7 weeks; rally from 114.90 to 118.53 in one week represents strongest momentum since pre-December levels with former resistance now support

── FUNDAMENTAL ASSESSMENT ───────────────────────
Fed at 3.50-3.75% after three 2025 cuts but hawkish 2026-27 guidance maintains terminal rate near 3% creating structurally bearish backdrop; however market has fully priced this creating asymmetric upside if data softens

── INSTITUTIONAL POSITIONING ────────────────────
Cautiously adding duration exposure following technical breakout but defensive positioning persists awaiting March FOMC clarity on 2026 easing trajectory

── OPTIONS FLOW ─────────────────────────────────
MOVE at 73.4 down from 70.1 peak signals reduced panic but remains in artificially compressed regime below historical median creating mean reversion setup with 15-20% expansion potential

── ECONOMIC BACKDROP ────────────────────────────
Fed held rates January 29 at 3.50-3.75% with two dissenting votes for cuts; inflation at 2.4% YoY sticky above target but showing moderation; March 17-18 FOMC next catalyst with near-zero cut probability priced

── VOLATILITY REGIME ────────────────────────────
Regime: LOW
Percentile: 22nd
Trend: Contracting ▼
Days in Regime: 28
Term Structure: Inverted - Short-term volatility at 10.5 compressed below medium-term 12.8 and long-term 14.3 reflecting artificially calm surface despite technical breakout; MOVE at 73.4 down from peaks suggests volatility compression continuing
Historical Pattern: Similar MOVE compressions below 75 during prior Fed pivot periods in 2018-19 preceded 15-20% volatility expansion spikes within 1-2 weeks as markets repriced; current 28-day low volatility regime approaching historical average duration of 30-35 days before mean reversion
Outlook: Moderate probability 55-65% of volatility expansion within 7-10 trading days as March FOMC approaches and technical breakout either confirms or fails; MOVE likely to expand toward 80-90 range from current 73.4 creating 10-20% spike potential
Trading Context: Artificially calm surface with MOVE at 73.4 and declining daily ranges masks structural uncertainty from technical breakout; expect daily ranges to expand from current 0.40-0.50 handles to 0.80-1.20 handles as March FOMC approaches and breakout either confirms or fails creating violent moves in either direction
Vol Risk/Opportunity: Moderate asymmetry emerging as volatility compression creates false sense of stability while technical breakout increases binary risk; limited downside from current 73.4 MOVE given below-median readings but substantial upside to 80-90 range representing 10-23% expansion potential creating opportunity for volatility plays ahead of March FOMC

── PRIMARY RISK ─────────────────────────────────
Bear market rally exhausts near 119-120 resistance with renewed selling if February economic data shows resilient growth and sticky inflation forcing market to reprice Fed terminal rate higher sending bonds back below 116.5
Probability: MEDIUM

── PRIMARY OPPORTUNITY ──────────────────────────
Duration rally extends toward 120-122 zone if economic data deteriorates materially through February or Fed officials moderate hawkish rhetoric ahead of March FOMC forcing short covering from oversold positioning after $1,300 December losses
Timeframe: Next 2-4 weeks through March 17-18 FOMC as February employment and inflation data releases provide easing justification and technical momentum carries through former resistance

── NEXT CATALYST ────────────────────────────────
Date: March 17, 2026
Event: Federal Reserve FOMC meeting March 17-18 with market pricing near-zero probability of cut but any dovish rhetoric or data deterioration between now and then could fuel continued duration rally
Expected Impact: HIGH

── FULL ANALYSIS ────────────────────────────────
ZB Treasury bond futures face a critical regime inflection on March 1, 2026, trading at 118.53 after breaking decisively above 116.5 resistance that capped moves for seven consecutive weeks following the catastrophic December 10 hawkish Fed pivot. Last week's CORRECT bullish call at 117.41 captured the initial breakout rally that has now extended to 118.53, gaining 0.96% (approximately $300 per contract) as momentum builds. This represents the strongest technical structure since pre-December levels and signals potential exhaustion of the panic selling that saw ZB lose over $1,300 per contract from 120+ levels. Historical context reveals this breakout comes after 11 weeks of post-hawkish repricing that followed the Fed's December dot plot showing only ONE additional cut in 2026 before terminal rate at 3%. The January 29 FOMC hold confirmed the shallow easing trajectory, yet Treasury yields have begun moderating—30-year at 4.64% (down from 4.82% peaks) and 10-year at 3.97%—suggesting the market is pricing reduced hawkish risk while maintaining defensive positioning. The MOVE index at 73.4 shows volatility compression from the 70.1 peak but remains elevated enough to signal potential mean reversion expansion ahead of the March 17-18 FOMC. The technical breakout above 116.5 is significant because it represents the first decisive violation of resistance since the December collapse, with former resistance now serving as support. Institutional positioning appears cautiously constructive with gradual duration extension following the breakout, though rotation signals from T-bills to international bonds earlier in February suggest waning Treasury demand that could limit rally potential. February seasonality provides neutral-to-slightly-positive tailwinds as institutional positioning shifts into Q1, though the post-hawkish repricing regime dominates all seasonal tendencies. The key tension is whether this represents a sustainable trend reversal or a bear market rally into resistance before resumption of the bearish trajectory driven by Fed terminal rate expectations near 3%. The regime is highly transitional—bonds face a binary path with either continued rally toward 119.5-121.0 if February data softens justifying duration extension, or exhaustion near current resistance if employment and CPI data show resilience cementing hawkish Fed stance. Current price at 118.53 represents a 3.12-handle recovery from mid-February lows but remains 2.53 handles (2.1%) below the pre-December-FOMC levels above 121, suggesting substantial upside potential if the technical breakout confirms trend reversal. With the March FOMC approaching and inflation data releases imminent through February, the market appears to be pricing moderate optimism about reduced Fed hawkishness while maintaining defensive positioning. The one-week rally from last Saturday's call at 117.41 to current 118.53 validates the bullish thesis that December panic exhaustion created asymmetric upside opportunity, though conviction remains capped at 6 given the structural bearish backdrop from Fed terminal rate guidance and the risk this is a technical bounce rather than fundamental regime change.

═════════════════════════════════════════════════
Source: Macro Agent Desk (macroagentdesk.com)


