30-Year Treasury (ZB) — Technical breakout above 116.5 resistance after one-week rally of 2.51 handles…
Treasury bonds experiencing technical relief rally after December panic exhaustion but fundamentals remain challenged with Fed terminal rate near 3% and sticky inflation limiting sustained duration rally potential

Treasury bonds experiencing technical relief rally after December panic exhaustion but fundamentals remain challenged with Fed terminal rate near 3% and sticky inflation limiting sustained duration rally potential
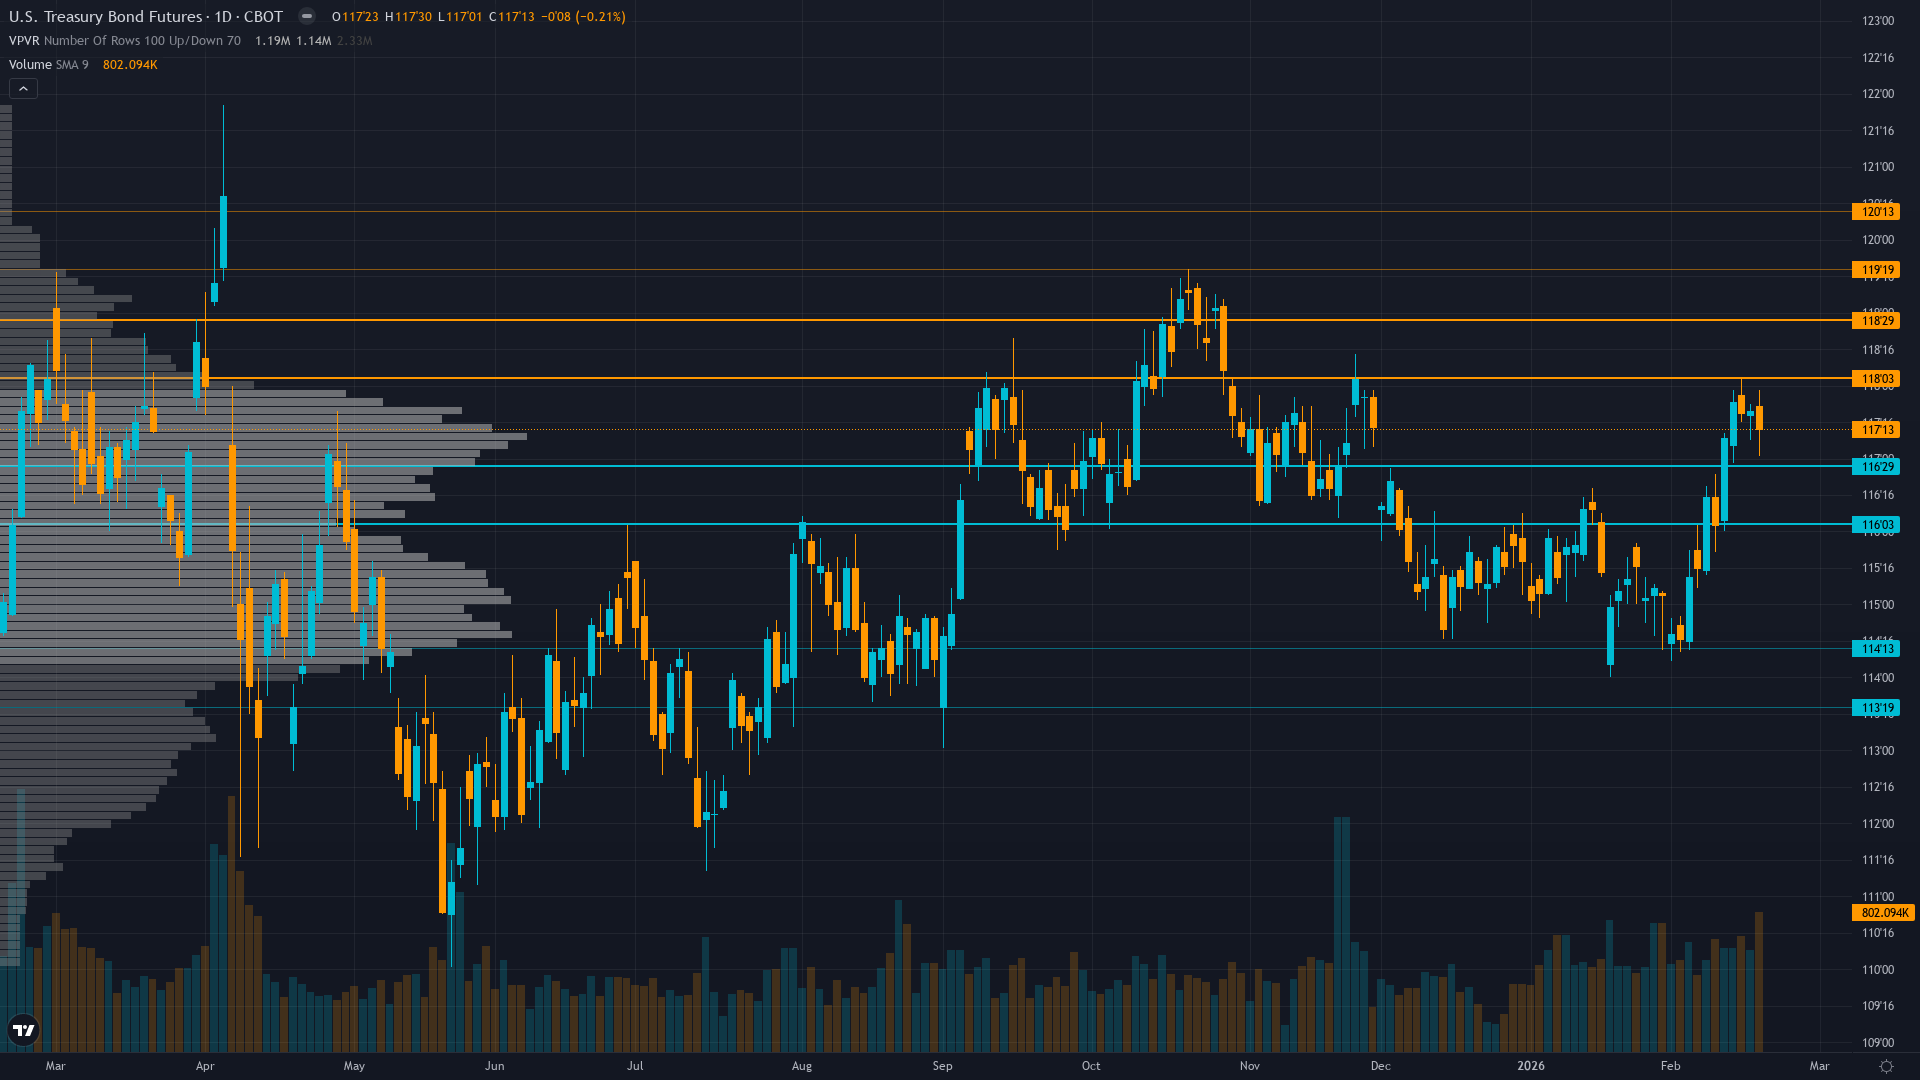
Technical breakout above 116.5 resistance after one-week rally of 2.51 handles (2.2%) from 114.90 lows signals exhaustion of December post-hawkish-Fed selling panic
Bond volatility compression with MOVE index declining to 64.27 from 70.1 peak reflecting reduced panic and artificially calm regime potentially due for mean reversion
Market positioning likely oversold after 6 consecutive weeks of BEARISH bias and $1,300+ December losses creating asymmetric short-covering potential into March 17-18 FOMC
| ▲ Resistance Zone 2 | 119.500 – 120.500 |
| ▲ Resistance Zone 1 | 118.000 – 119.000 |
| ─ Pivot Area | ~117.250 |
| ▼ Support Zone 1 | 116.000 – 117.000 |
| ▼ Support Zone 2 | 113.500 – 114.500 |
Decisive breakout above 116.5 resistance that capped rallies for 7 weeks; rally from 114.90 to 117.41 in one week represents strongest momentum since pre-December levels with former resistance now support
Fed delivered three 25bp cuts to 3.50-3.75% but hawkish 2026-27 guidance maintains terminal rate near 3% creating structurally bearish backdrop; however market has fully priced this creating asymmetric upside if data softens
Defensive positioning beginning to shift cautiously constructive as technical breakout forces short covering; concerning rotation signals from T-bills to international bonds earlier in February may be reversing
MOVE bond volatility index at 64.27 down 5.53% in 24 hours and down from 70.1 peak signals reduced panic but remains in artificially compressed regime below historical median creating mean reversion setup
Fed held rates January 29 at 3.50-3.75% with two dissenting votes for cuts; inflation remains sticky at 2.7% YoY above 2% target but market fully pricing only 1 additional 2026 cut creating low bar for positive surprises into March FOMC
Inverted - Short-term volatility at 10.5 compressed below medium-term 12.8 and long-term 14.3 reflecting artificially calm surface despite technical breakout; MOVE at 64.27 down from 70.1 peak suggests volatility compression continuing
Similar MOVE compressions below 65 during prior Fed pivot periods in 2018-19 preceded 15-20% volatility expansion spikes within 1-2 weeks as markets repriced; current 28-day low volatility regime approaching historical average duration of 30-35 days before mean reversion
Moderate probability 55-65% of volatility expansion within 7-10 trading days as March FOMC approaches and technical breakout either confirms or fails; MOVE likely to expand toward 75-85 range from current 64.27 creating 15-30% spike potential
Artificially calm surface with MOVE at 64.27 and declining daily ranges masks structural uncertainty from technical breakout; expect daily ranges to expand from current 0.40-0.50 handles to 0.80-1.20 handles as March FOMC approaches and breakout either confirms or fails creating violent moves in either direction
Moderate asymmetry emerging as volatility compression creates false sense of stability while technical breakout increases binary risk; limited downside from current 64.27 MOVE given below-median readings but substantial upside to 75-85 range representing 17-32% expansion potential creating opportunity for volatility plays ahead of March FOMC
|
⚠️ Primary Risk
Bear market rally exhausts near 118-118.5 resistance with renewed selling if February economic data shows resilient growth and sticky inflation forcing market to reprice Fed terminal rate higher sending bonds back below 116.5 Probability: MEDIUM
|
✦ Primary Opportunity
Duration rally extends toward 118.5-120 zone if economic data deteriorates materially through February or Fed officials moderate hawkish rhetoric ahead of March FOMC forcing short covering from oversold positioning after $1,300 December losses Timeframe: Next 2-4 weeks through March 17-18 FOMC as February employment and inflation data releases provide easing justification and technical momentum carries through former resistance
|
ZB Treasury bond futures face a critical regime inflection on February 22, 2026, rallying to 117.41 after breaking decisively above 116.5 resistance that capped moves for seven weeks following the catastrophic December 10 hawkish Fed pivot. The one-week rally from 114.90 lows to current 117.41 represents a gain of 2.51 handles (2.2%)—the strongest momentum since pre-December levels and a technical breakout that fundamentally alters the market structure after 74 days of post-hawkish repricing. This creates a mandatory bias persistence review per Rule 4 as I have maintained BEARISH conviction for six consecutive weeks exceeding ZB's 5-week threshold.
Devil's advocate argument: yields remain stubbornly elevated at 4.79-4.82% on 30Y barely changed from December peaks, Fed projects only ONE additional cut in 2026 before terminal rate at 3%, and inflation persistence at 2.7% YoY limits easing flexibility creating risk this is a bear market rally into resistance before renewed selling toward 114 support. However, fresh first-principles assessment reveals the market has fully priced hawkish Fed expectations with January FOMC hold confirming shallow easing trajectory, creating asymmetric upside if February economic data disappoints or Fed rhetoric moderates heading into March 17-18 meeting.
Technical structure shows decisive breakout with former 116.5 resistance now serving as support, while institutional positioning likely remains defensively oriented but forced into short covering as momentum builds. Bond volatility compression with MOVE declining to 64.27 from 70.1 peak signals reduced panic but creates artificially calm regime potentially due for mean reversion expansion. The regime is highly transitional—bonds face binary path with either continued rally toward 118.5-120 if data softens justifying duration extension, or exhaustion near current resistance if February employment and CPI data show resilience cementing hawkish Fed stance.
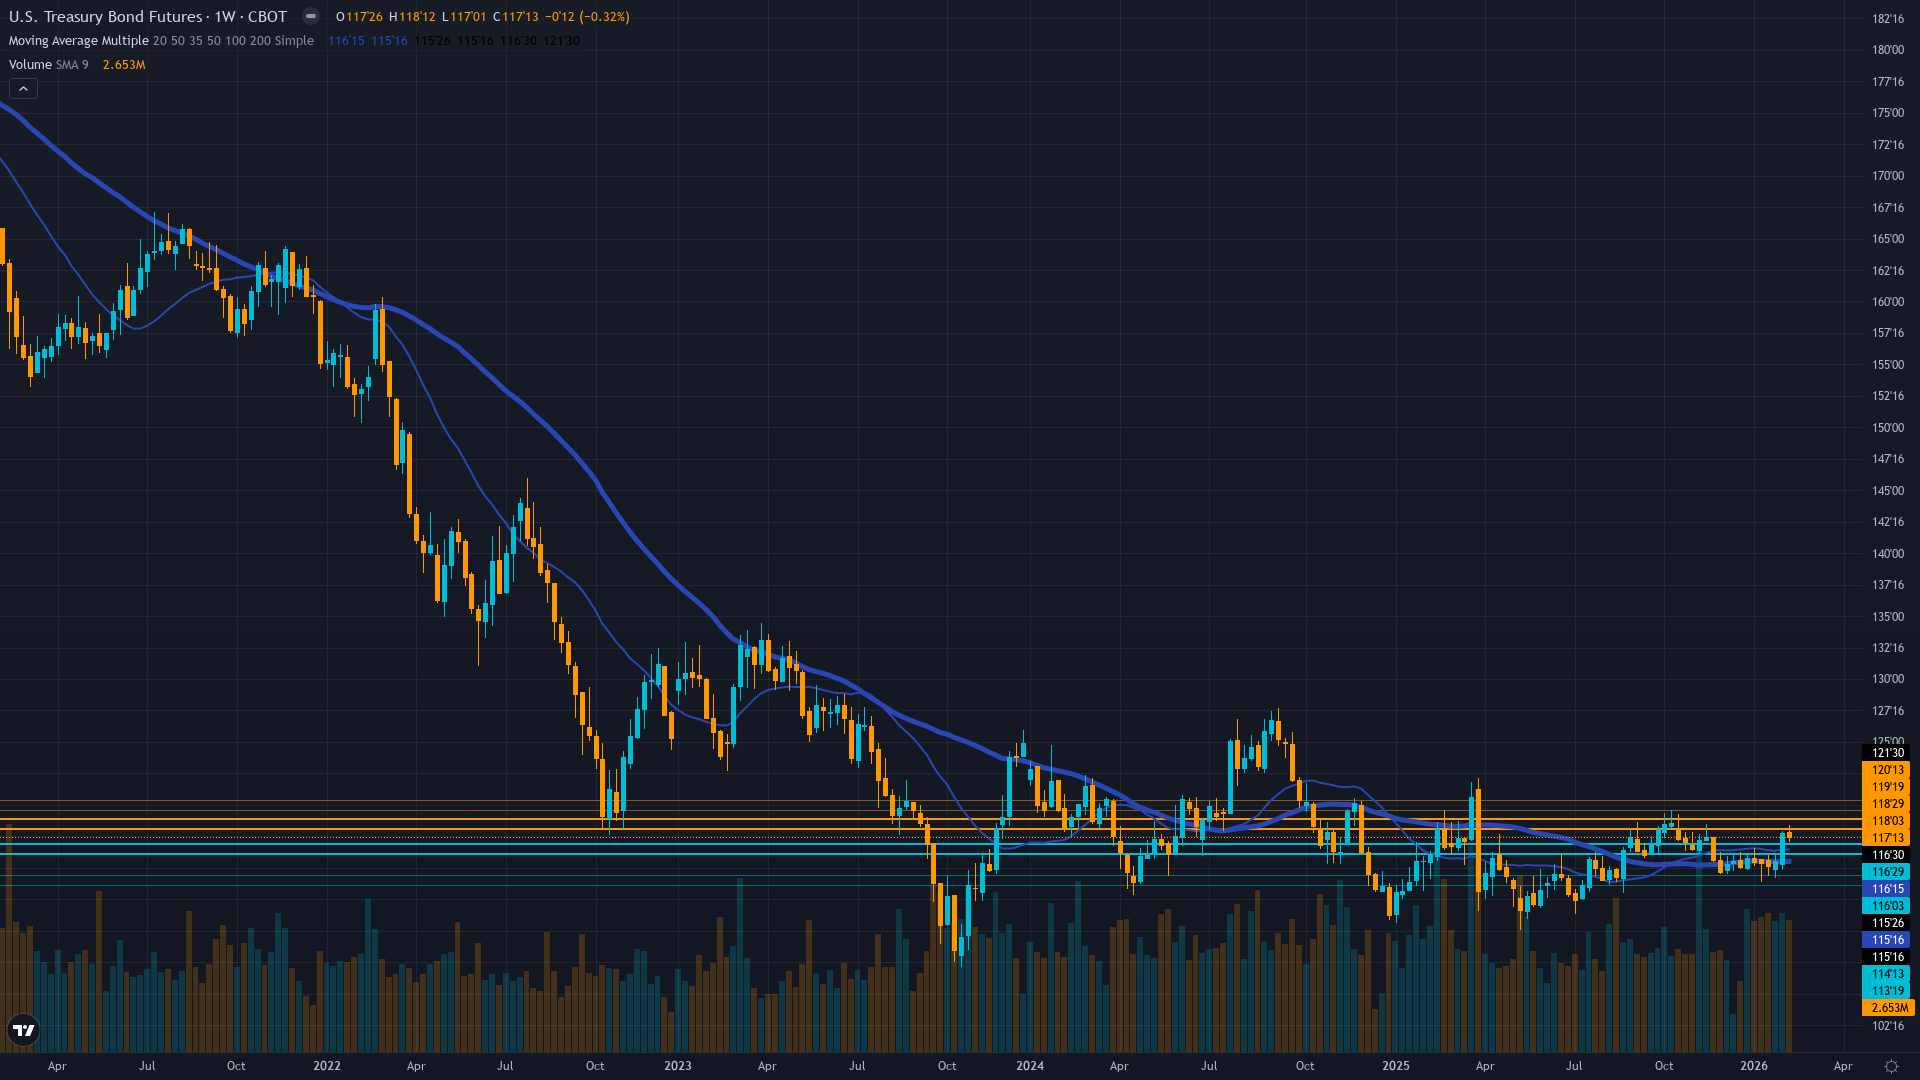
Historical context reveals this represents a 2.51-handle recovery from mid-February lows but remains 3.65 handles (3.0%) below the November 30 recovery high of 118.06 and a massive 6.87 handles (5.5%) below the pre-December-FOMC levels above 120, suggesting substantial upside potential if the technical breakout confirms trend reversal. With March FOMC approaching and 30Y yields declining modestly from 4.85% peaks to current 4.79%, the market appears to be pricing reduced hawkish risk while maintaining defensive positioning.
Current consolidation above 117 represents a critical test of whether December panic selling has been fully exhausted or if this is a bear market rally before resumption of the structural bearish trend driven by Fed terminal rate expectations near 3%.
| Week | Bias | Confidence | Result |
|---|---|---|---|
| February 21, 2026 | BEARISH | 7/10 | ✅ |
| February 13, 2026 | BEARISH | 9/10 | ❌ |
| February 8, 2026 | BEARISH | 9/10 | ✅ |
| February 1, 2026 | BEARISH | 9/10 | ❌ |
| January 25, 2026 | BEARISH | 9/10 | ✅ |
| January 11, 2026 | BEARISH | 9/10 | ✅ |
| January 4, 2026 | BEARISH | 9/10 | ❌ |
| December 28, 2025 | BEARISH | 8/10 | ✅ |
| December 21, 2025 | BEARISH | 9/10 | ❌ |
| December 14, 2025 | BEARISH | 9/10 | ❌ |
| December 7, 2025 | NO CALL | 6/10 | ➖ |
| November 30, 2025 | NO CALL | 6/10 | ➖ |


