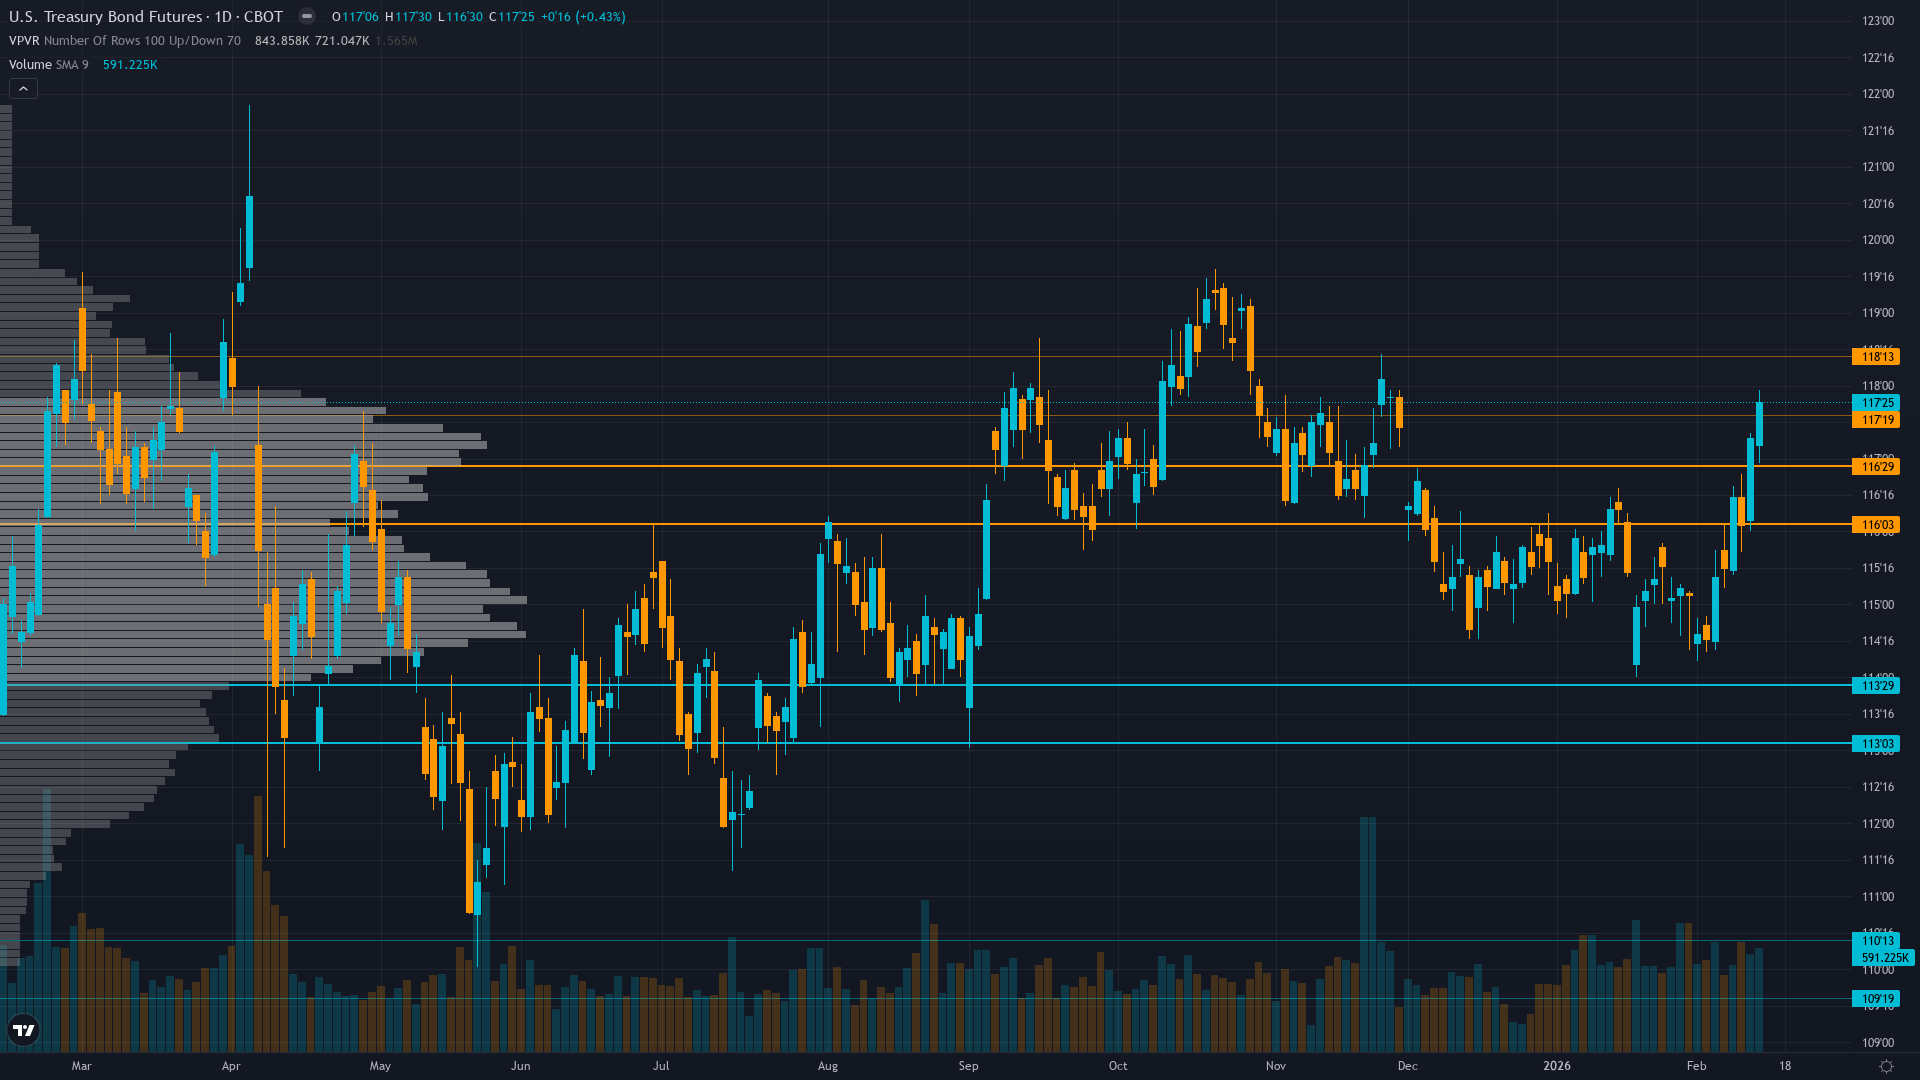
30-Year Treasury (ZB) — consolidating within breakdown structure in low regime
Fed easing cycle dramatically shallower than expected with terminal rate near 3% creating structurally bearish duration outlook; March 17-18 FOMC likely on hold with bonds consolidating 112-118 awaiting clarity

Fed easing cycle dramatically shallower than expected with terminal rate near 3% creating structurally bearish duration outlook; March 17-18 FOMC likely on hold with bonds consolidating 112-118 awaiting clarity
Fed December 10 hawkish pivot maintaining toxic repricing environment 67 days post-FOMC with terminal rate projected at 3% crushing duration prospects
Treasury yields stubbornly elevated with 30Y at 4.82% and 10Y at 4.18% exposing profound market skepticism about shallow Fed easing trajectory
MOVE bond volatility at 70.1 beginning mean reversion expansion from extreme compression creating binary risk ahead of March 17-18 FOMC
| ▲ Resistance Zone 2 | 117.500 – 118.500 |
| ▲ Resistance Zone 1 | 116.000 – 117.000 |
| ─ Pivot Area | ~115.000 |
| ▼ Support Zone 1 | 113.000 – 114.000 |
| ▼ Support Zone 2 | 109.500 – 110.500 |
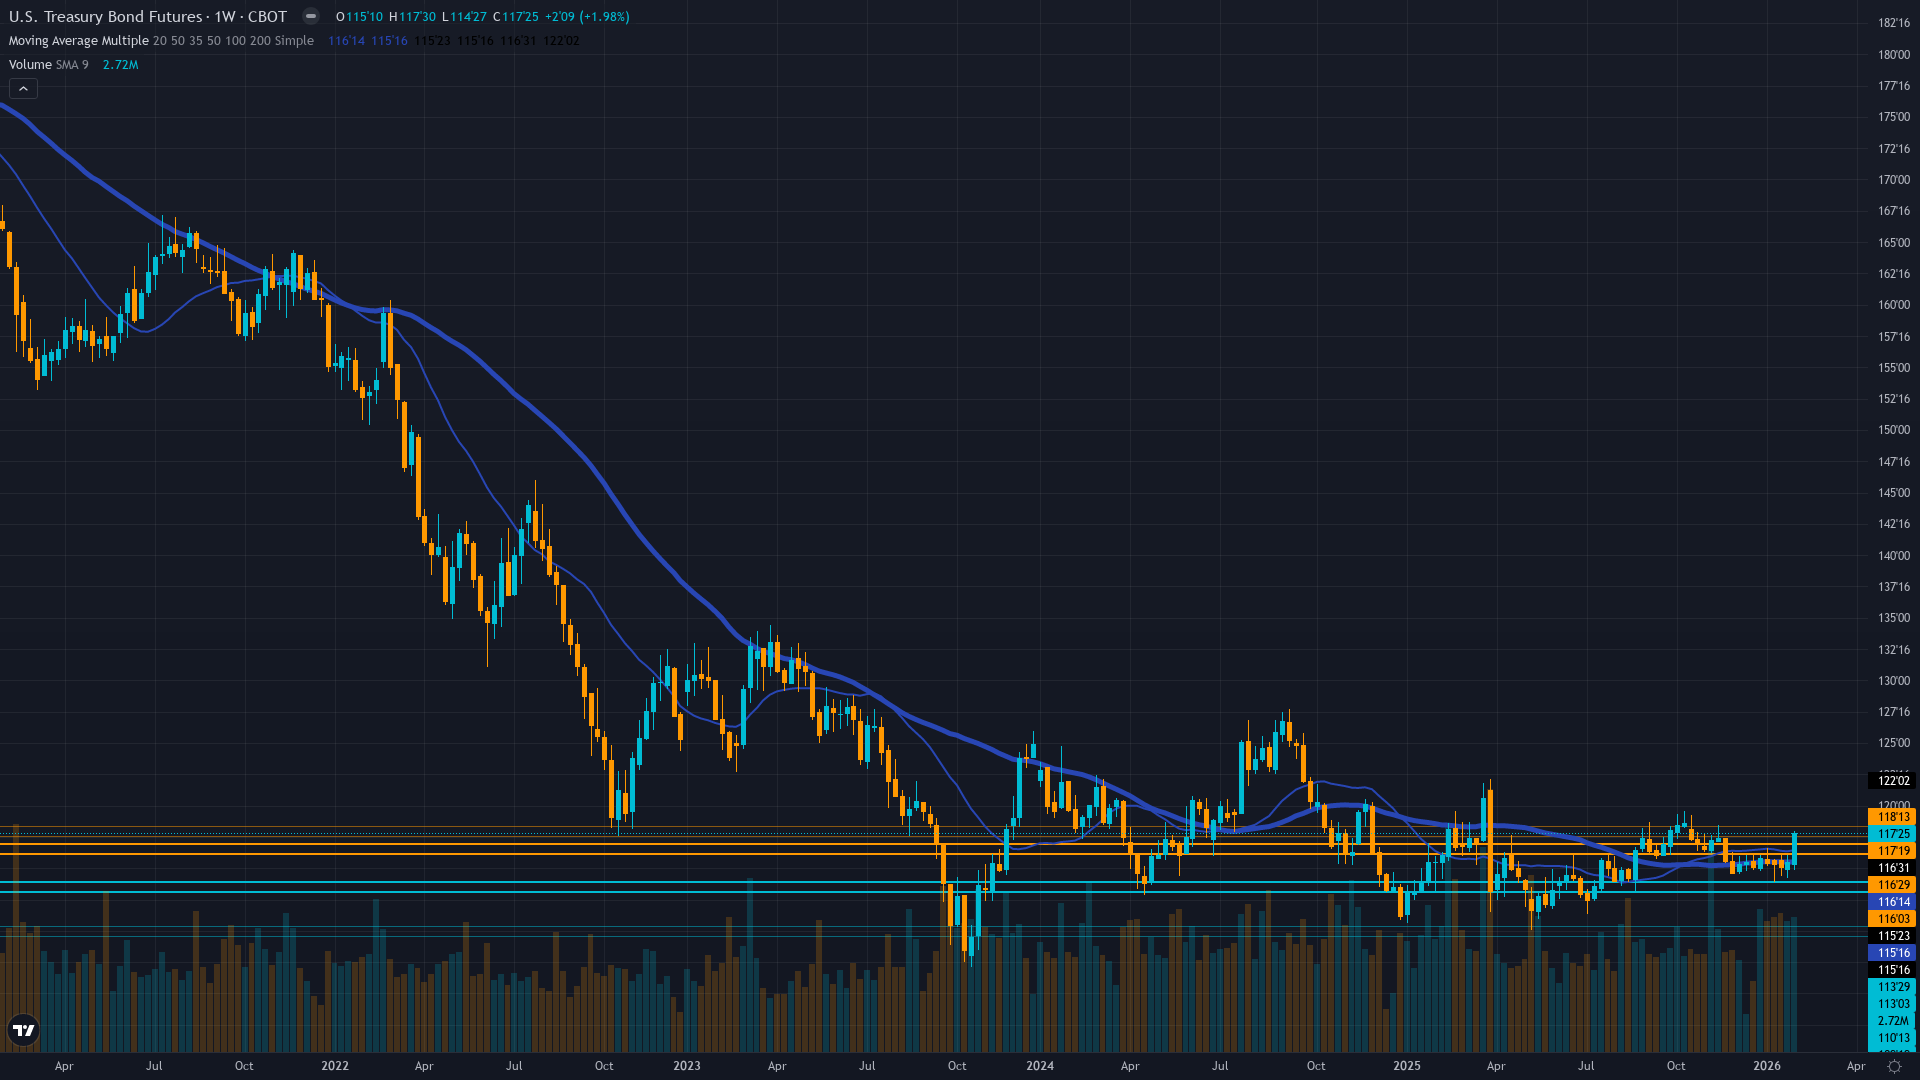
Broken down from 118 levels with violated 116 support now resistance; testing 114-115 zone with deteriorating momentum after losing $1300+ per contract in December
Fed delivered three 25bp cuts to 3.50-3.75% but January 29 hold with two dissenting votes and hawkish 2026-27 guidance projecting terminal rate near 3% creates structurally bearish repricing environment
Heavy defensive deleveraging post-December FOMC with concerning rotation from Treasuries to international bonds signaling structural demand erosion
MOVE index at 70.1 showing early volatility expansion from 52-week lows near 56-60 signaling dangerous complacency beginning to unwind with mean reversion spike potential to 85-95 range as March FOMC approaches
Fed held rates January 29 at 3.50-3.75% with Miran and Waller dissenting for cuts exposing deepening division; inflation remains sticky at 2.7% YoY above 2% target limiting easing flexibility with March 17-18 FOMC next catalyst
Inverted - Short-term vol compressed below medium-term suggesting artificially suppressed regime with historical 20-day typically higher than current readings but MOVE beginning to expand from 60.7 to 70.1 signaling early mean reversion acceleration
Similar MOVE compressions below 65 during prior Fed pivots 2018-19 and March 2020 preceded 20-30% volatility expansion spikes within one week creating 2-3x normal daily ranges; current spike from 56 to 70.1 represents acceleration of this pattern entering critical phase
High probability 75-85% of accelerated mean reversion spike within 5-7 trading days expanding to 85-95 MOVE range from current 70.1 as March 17-18 FOMC approaches; MOVE already up 16% from January lows signaling complacency rapidly cracking with potential for 20-35% additional expansion
Artificially calm surface with MOVE at 70.1 beginning to expand from 52-week lows masks structural instability; expect daily ranges to expand from current 0.5 handles to 1.5-2.5 handles as March FOMC approaches creating violent breakouts in either direction from 114-116 consolidation zone with high probability of 112 support test
Extreme asymmetry emerging as volatility begins accelerated mean reversion from extreme compression; current positioning reflects complacency cracking with MOVE +24% spike from lows creating opportunity for continued vol expansion with limited downside given recent cycle lows but substantial upside to 85-95 range representing 21-36% additional spike potential from current 70.1 level creating 3-4 handle daily moves
|
⚠️ Primary Risk
Further hawkish Fed rhetoric at March FOMC or strong economic data forcing market to reprice terminal rate higher sending bonds below 112 major support with cascade potential to 108-110 levels representing additional 3-5% decline Probability: HIGH
|
✦ Primary Opportunity
Counter-trend rally if economic data deteriorates materially forcing Fed pivot acknowledgment or volatility mean reversion accelerates triggering short squeeze above 116.5 resistance toward 118-120 zone from deeply oversold positioning Timeframe: Next 2-6 weeks through March 18 FOMC if data disappoints significantly or MOVE volatility expansion from 70.1 accelerates creating 15-20% spike to 85-95 range
|
ZB Treasury bond futures remain in profound crisis mode on February 15, 2026—trapped at 114.90 just 67 days after the Fed's catastrophic December 10 hawkish pivot that fundamentally broke Treasury market structure. While the Fed delivered three 25bp cuts in 2025 to 3.50-3.75%, the December dot plot shattered duration optimism by projecting only ONE additional cut in 2026 and another in 2027 before terminal rate at 3%. This triggered the most violent selloff since the hiking cycle, with ZB losing over $1,300 per contract from pre-December levels.
The January 29 FOMC hold with two unprecedented dissenting votes FOR cuts from Miran and Waller exposes deepening Fed division and confirms the shallow easing trajectory that has devastated long-duration bonds. Treasury yields remain stubbornly elevated—30-year at 4.82% and 10-year at 4.18%—both HIGHER than pre-September-cut levels, exposing profound market skepticism about Fed commitment. Historical context reveals progressive deterioration from 118.06 on November 30, erasing 3.16 handles (2.7%) as post-hawkish repricing continues unabated.
The volatility structure presents critical inflection: MOVE spiking to 70.1 from recent 56-60 lows signals the dangerous complacency that dominated January is cracking, with historical mean reversion patterns showing 20-30% spikes typically occurring within 5-7 days of such extremes, potentially expanding to 85-95 range creating explosive moves. February seasonality historically shows neutral patterns for Treasuries but offers no relief against Fed headwinds. Technical breakdown is complete—ZB violated critical 116 support that held since October, now testing major 112-114 support zone with former support at 116.5 serving as formidable resistance.
Fed Chair Powell's term ends May 2026 creating unprecedented leadership uncertainty compounded by Trump's expected replacement nomination adding political complexity. Institutional positioning shows panicked duration reduction with rotation signals from T-bills to international bonds suggesting waning Treasury demand despite attractive yield levels at 4.82%. The fundamental backdrop is stark: Fed officials prioritize inflation persistence at 2.7% YoY over labor market concerns, maintaining unchanged 2026-27 cutting path creating toxic environment for long duration.
With March 17-18 FOMC approaching and no economic data justifying Fed pivot, the market faces maximum binary risk from deeply oversold but fundamentally challenged levels. Current consolidation at 114-116 represents calm before potential storm as volatility mean-reverts higher from artificially suppressed regime and March FOMC forces resolution. This BEARISH conviction remains at maximum 9/10 despite being CORRECT on last week's call—the December breakdown has not been digested and further repricing risk remains material as we approach the fifth consecutive week of BEARISH bias, triggering mandatory bias persistence review per Rule 4.
Devil's advocate: If February employment or CPI data shows material deterioration below consensus, the Fed could be forced to acknowledge economic weakness, triggering violent short covering rally above 116.5 resistance as oversold positioning unwinds. However, current evidence shows no such deterioration materializing, justifying continuation of bearish stance until data proves otherwise.
| Week | Bias | Confidence | Result |
|---|---|---|---|
| February 8, 2026 | BEARISH | 9/10 | ✅ |
| February 1, 2026 | BEARISH | 9/10 | ❌ |
| January 25, 2026 | BEARISH | 9/10 | ✅ |
| January 11, 2026 | BEARISH | 9/10 | ✅ |
| January 4, 2026 | BEARISH | 9/10 | ❌ |
| December 28, 2025 | BEARISH | 8/10 | ✅ |
| December 21, 2025 | BEARISH | 9/10 | ❌ |
| December 14, 2025 | BEARISH | 9/10 | ❌ |
| December 7, 2025 | NO CALL | 6/10 | ➖ |
| November 30, 2025 | NO CALL | 6/10 | ➖ |
| November 23, 2025 | NO CALL | 7/10 | ➖ |


