30-Year Treasury (ZB) — Fed December 10 hawkish pivot projecting only 2 cuts through 2027 maintains…
Fed easing cycle dramatically shallower than expected with terminal rate near 3% creating structurally bearish duration outlook; bonds likely consolidate 112-118 awaiting March FOMC clarity with pause expected

Fed easing cycle dramatically shallower than expected with terminal rate near 3% creating structurally bearish duration outlook; bonds likely consolidate 112-118 awaiting March FOMC clarity with pause expected
Fed December 10 hawkish pivot projecting only 2 cuts through 2027 maintains toxic repricing 53 days post-FOMC with January 29 hold at 3.50-3.75% confirming shallow easing trajectory
Treasury yields stubbornly elevated with 30Y at 4.82% and 10Y at 4.26% exposing profound market skepticism about Fed easing commitment despite three 2025 cuts
MOVE bond volatility at 60.7 near 52-week lows creating dangerous complacency paradox with mean reversion spike imminent after violent December selloff
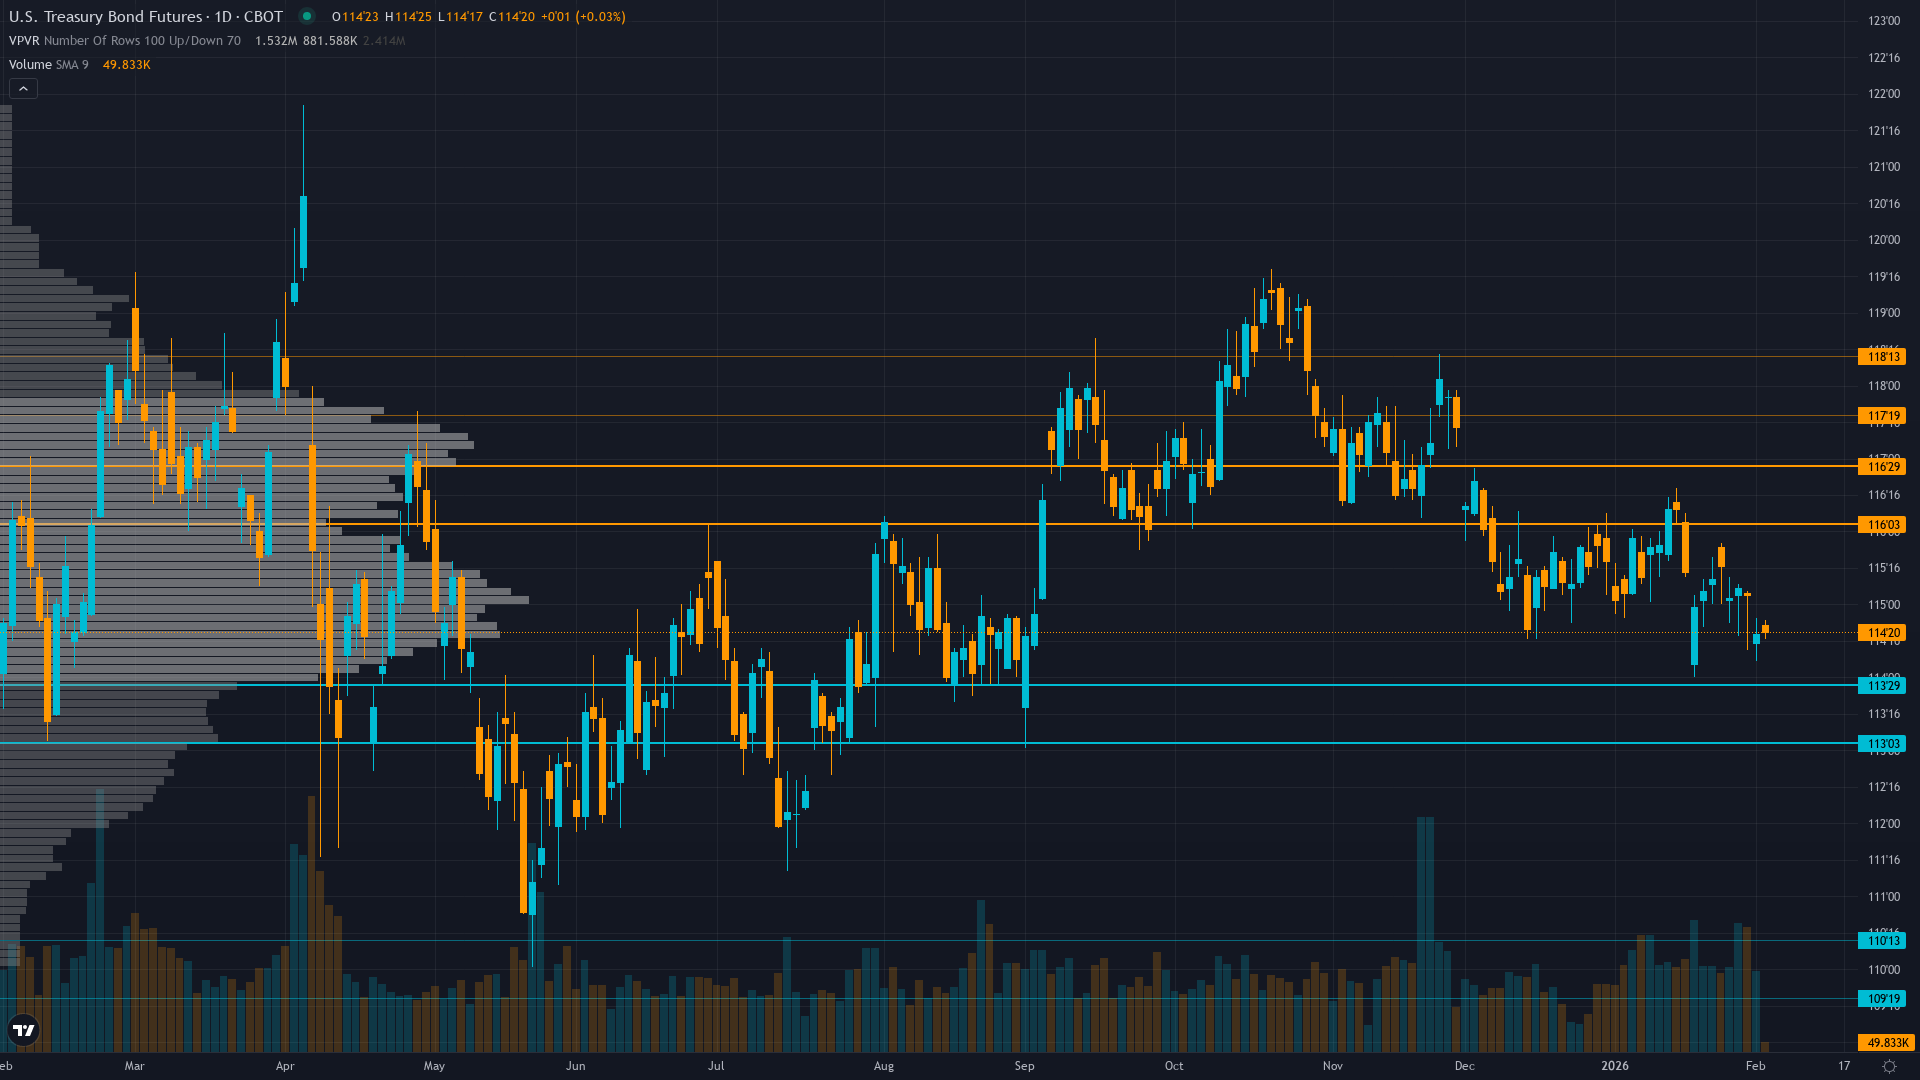
| ▲ Resistance Zone 2 | 117.500 – 118.500 |
| ▲ Resistance Zone 1 | 116.000 – 117.000 |
| ─ Pivot Area | ~115.000 |
| ▼ Support Zone 1 | 113.000 – 114.000 |
| ▼ Support Zone 2 | 109.500 – 110.500 |
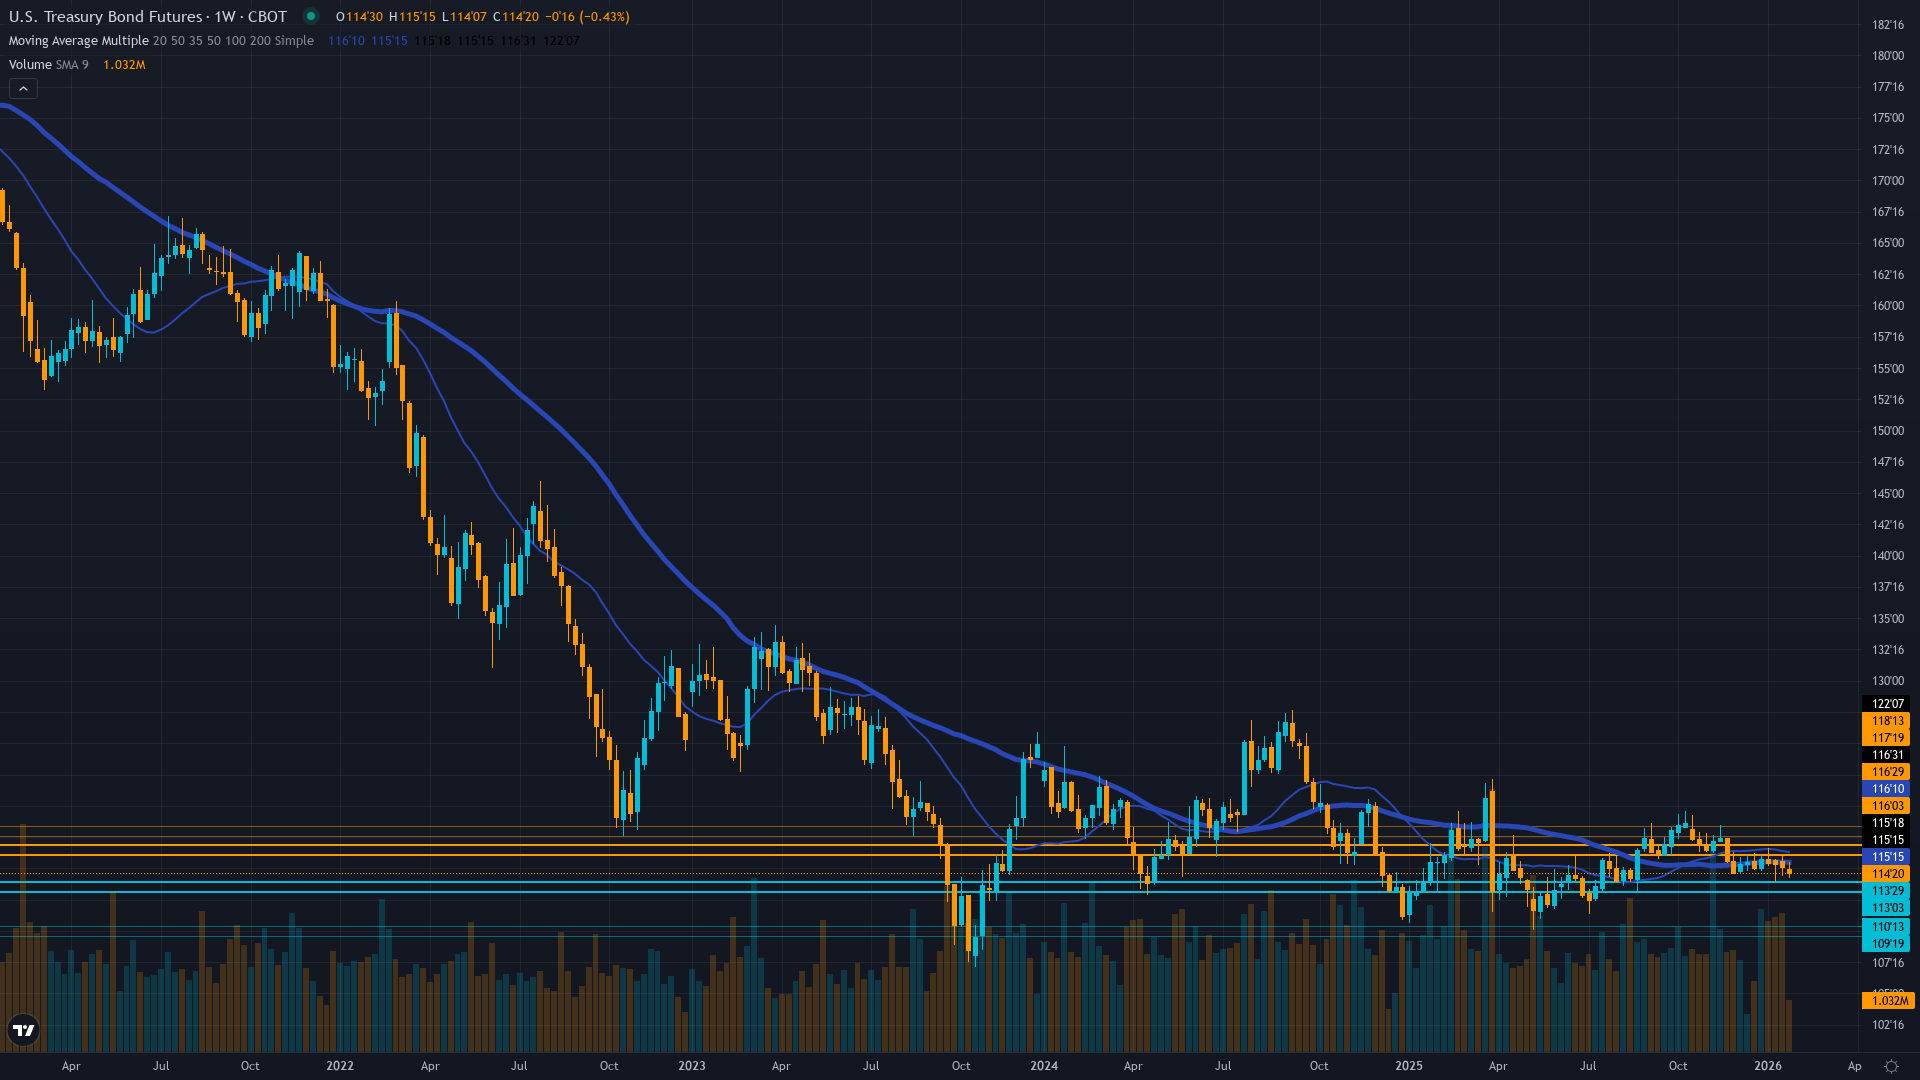
Broken down from 118 levels with violated 116 support now resistance testing 114-115 zone with deteriorating momentum after losing $1300+ per contract in December selloff
Fed delivered three 25bp cuts to 3.50-3.75% but January 29 hold and hawkish 2026-27 guidance projects terminal rate near 3% creating structurally bearish repricing environment for long duration
Heavy defensive deleveraging post-December FOMC with concerning rotation from Treasuries to international bonds signaling structural Treasury demand erosion
MOVE index at 60.7 near 52-week lows reflecting extreme volatility compression despite historic December violence creating dangerous complacency with 15-20% mean reversion expansion likely within 5-7 days
Fed held rates January 29 at 3.50-3.75% with two dissenting votes for cuts exposing division; inflation at 2.7% YoY remains sticky above target limiting easing flexibility
Inverted - Short-term vol compressed below medium-term suggesting artificially suppressed regime with historical 20-day typically higher than current 5-day readings
Similar MOVE compressions below 65 during prior Fed pivots 2018-19 and March 2020 preceded 15-20% volatility expansion spikes within one week creating 2-3x normal daily ranges
High probability 70-80% of mean reversion spike within 5-7 trading days expanding to 70-85 MOVE range from current 60.7 as March FOMC approaches and year-end positioning fully unwinds
Current artificially calm surface with MOVE at 52-week lows masks structural instability; expect daily ranges to expand from current 0.5 handles to 1.5-2.0 handles post-catalyst creating violent breakouts in either direction from 114-116 consolidation zone
Extreme asymmetry; current positioning reflects maximum complacency despite binary March FOMC catalyst creating opportunity for vol expansion with limited downside given MOVE at cycle lows but substantial upside to 70-85 range representing 25-50% vol spike potential
|
⚠️ Primary Risk
Further hawkish Fed rhetoric at March FOMC or strong economic data forcing market to reprice terminal rate higher sending bonds below 112 major support with cascade potential to 108-110 levels Probability: HIGH
|
✦ Primary Opportunity
Counter-trend rally if economic data deteriorates materially forcing Fed pivot acknowledgment or volatility mean reversion triggers short squeeze above 116.5 resistance toward 118-120 zone from deeply oversold positioning Timeframe: Next 2-6 weeks through March FOMC if data disappoints significantly or MOVE volatility mean-reverts from extreme 52-week lows creating 15-20% spike
|
ZB Treasury bond futures remain in profound crisis mode on February 1, 2026, trapped at 114.94 just 53 days after the Fed's catastrophic December 10 hawkish pivot—the defining regime shift that fundamentally broke Treasury market structure. While the Fed delivered three 25bp cuts in 2025 to 3.50-3.75%, the December dot plot shattered duration optimism by projecting only ONE additional cut in 2026 and another in 2027 before terminal rate at 3%. This triggered the most violent selloff since the hiking cycle, with ZB losing over $1,300 per contract from pre-December levels.
The January 29 FOMC hold with two dissenting votes FOR cuts (Miran and Waller) exposes deepening Fed division and confirms the shallow easing trajectory. Treasury yields remain stubbornly elevated—30-year at 4.82% and 10-year at 4.26%—both HIGHER than pre-September-cut levels, exposing profound market skepticism. The volatility paradox is stark: MOVE at 60.7 sits at 52-week LOWS despite $1,300+ losses, suggesting extreme complacency with historical mean reversion patterns showing 15-20% spikes occurring within 5-7 days of such extremes.
February seasonality historically neutral for Treasuries offers no relief. Technical breakdown is complete—ZB violated critical 116 support that held since October, now testing major 112-114 support with former support at 116.5 serving as formidable resistance. Fed Chair Powell's term ends May 2026 creating unprecedented leadership uncertainty compounded by Trump's expected replacement nomination. Institutional positioning shows panicked duration reduction with rotation signals from T-bills to international bonds suggesting waning Treasury demand.
With inflation at 2.7% YoY remaining sticky above the Fed's 2% target and March 18 FOMC approaching, the market faces binary outcomes: either economic deterioration forces Fed accommodation (bullish duration above 116.5) or data resilience cements hawkish stance (bearish with targets below 112 toward 108-110). Current consolidation at 114-116 represents the calm before potential storm as volatility mean-reverts and March FOMC forces resolution of post-hawkish repricing uncertainty.
| Week | Bias | Confidence |
|---|---|---|
| February 1, 2026 | BEARISH | 9/10 |
| January 25, 2026 | BEARISH | 9/10 |
| January 18, 2026 | BEARISH | 9/10 |
| January 11, 2026 | BEARISH | 9/10 |
| January 4, 2026 | BEARISH | 9/10 |
| December 28, 2025 | BEARISH | 8/10 |
| December 21, 2025 | BEARISH | 9/10 |
| December 14, 2025 | BEARISH | 9/10 |
| December 7, 2025 | NEUTRAL | 6/10 |
| November 30, 2025 | NEUTRAL | 6/10 |
| November 23, 2025 | NEUTRAL | 7/10 |
| November 16, 2025 | NEUTRAL | 7/10 |


