Wheat Key Levels This Week — Support, Resistance & Confluence Zones
Wheat key levels breakdown: support zones, resistance zones, confluence and price structure.

Where Price Sits
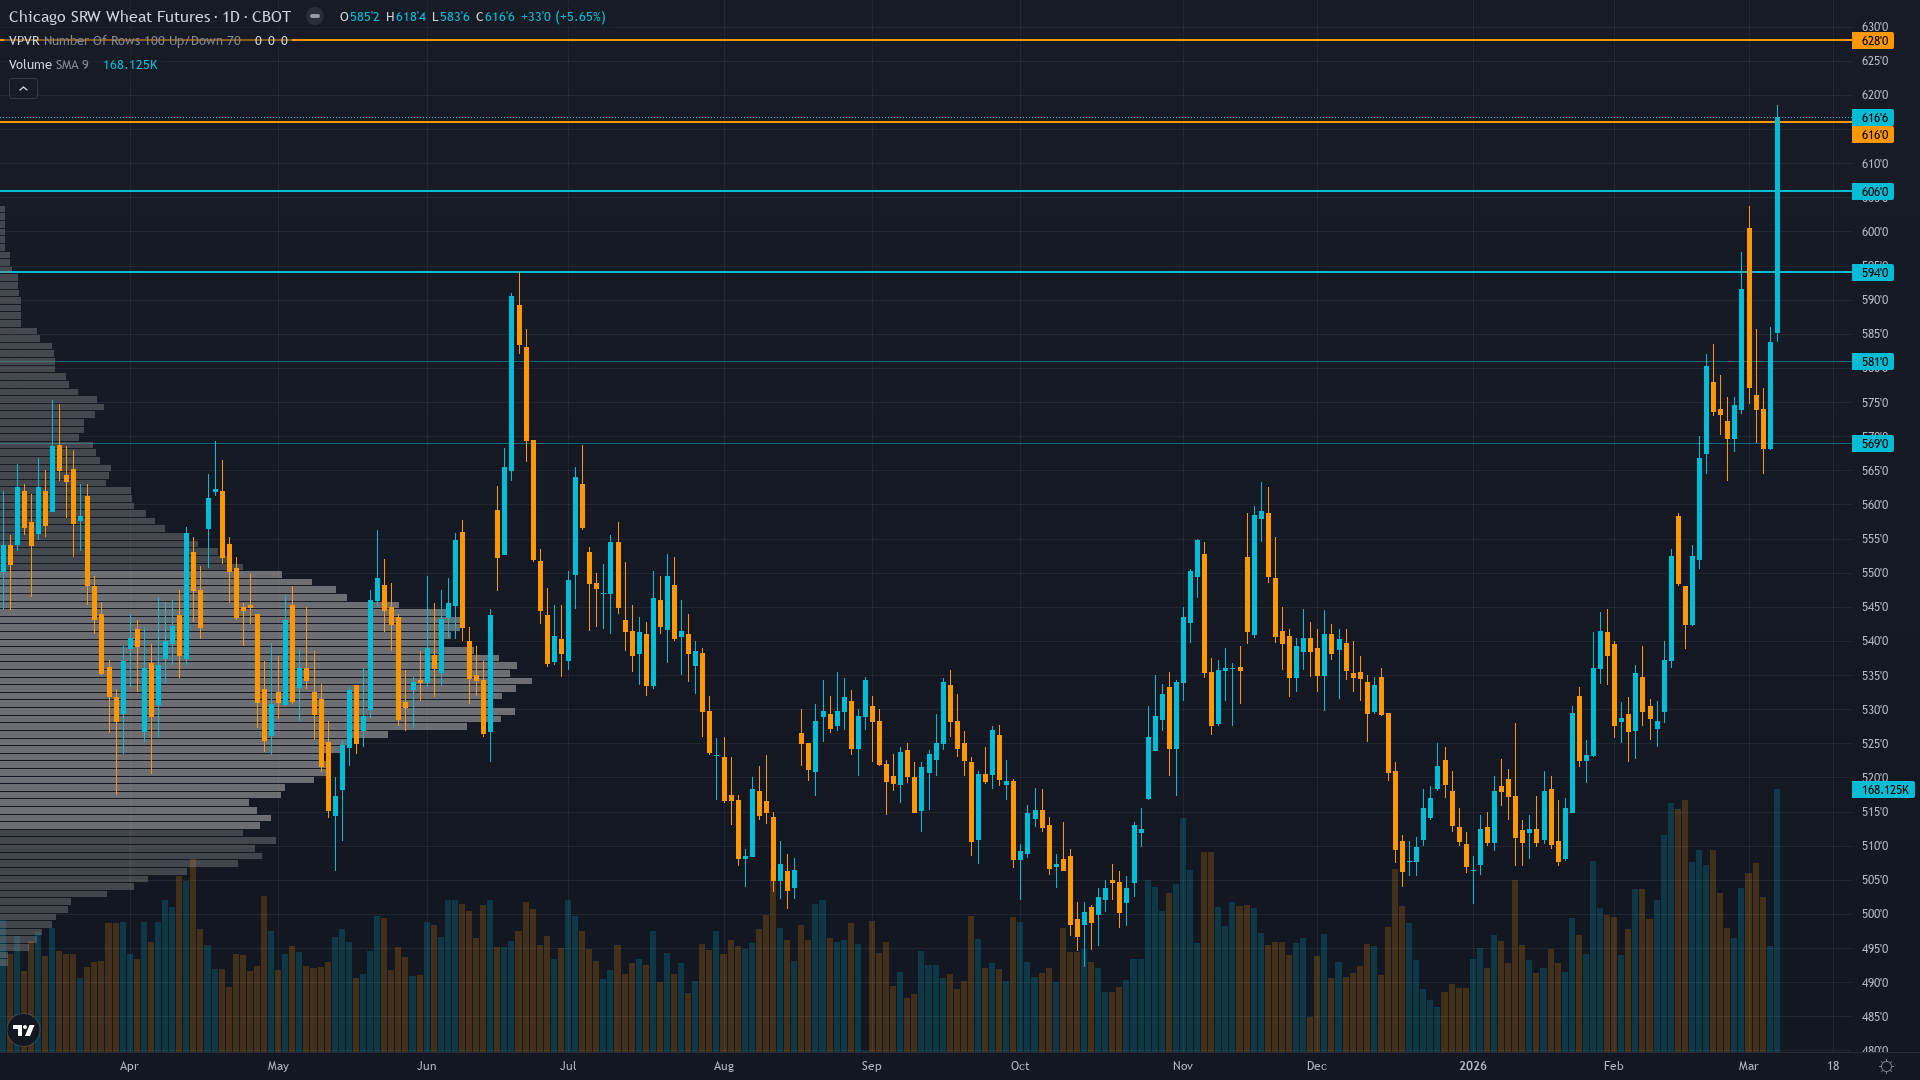
wheat pushed to 618.25 on a 5.61% advance, reflecting sustained demand across the session. wheat futures is in a trending up market state, requiring careful assessment of current conditions.
Strong 25.6% rally from October 492 lows to 618.25 breaking above all major resistance with momentum sustained and technical indicators showing strong buy signals testing 52-week highs near 622
With trend strength at 8/10, the prevailing move carries significant force behind it.
Floors & Demand Zones
wheat price has identifiable support zones below current price where buying interest has historically emerged. These zones represent areas where institutional participants have previously defended price, creating potential floors for pullbacks.
How effectively these zones hold depends on the prevailing regime and whether the volume profile confirms institutional participation.
Resistance Architecture
Above current price, ZW futures encounters structural resistance defined by prior supply zones and profit-taking clusters. These barriers must be overcome convincingly for the upside thesis to develop.
The reliability of resistance depends on the number of touches and the volume traded at each level.
Multi-Agent Confluence
What separates high-probability levels from noise is multi-discipline agreement. The key zones for wheat price are those where technical structure aligns with institutional positioning and options market activity.
Daily ranges expanded from compressed 10-16 cents during consolidation to current 25-40 cent action requiring significantly wider stops but offering proportionally higher reward potential breakout above 622 or breakdown below 600 would trigger accelerated moves given extreme positioning and expanding volatility environment ahead of March 10 WASDE
The Intelligence Behind the Levels
Our multi-agent system analyses key levels from six perspectives simultaneously: technical structure identifies the zones, institutional positioning reveals where smart money is engaged, options flow shows where hedging clusters, fundamentals assess whether levels align with fair value, sentiment measures crowd positioning around levels, and economic data flags catalysts that could trigger level tests.
The result is a set of levels that reflect genuine multi-agent consensus, not the output of a single indicator or a retail trader drawing trendlines.
Our paid reports include specific support and resistance levels identified by six specialist agents — technical structure, institutional positioning, options flow, fundamentals, sentiment, and economic analysis. Not just lines on a chart, but zones validated by multi-discipline confluence.
Start Free — Get the Market of the WeekFree weekly report · No credit card · Upgrade anytime


