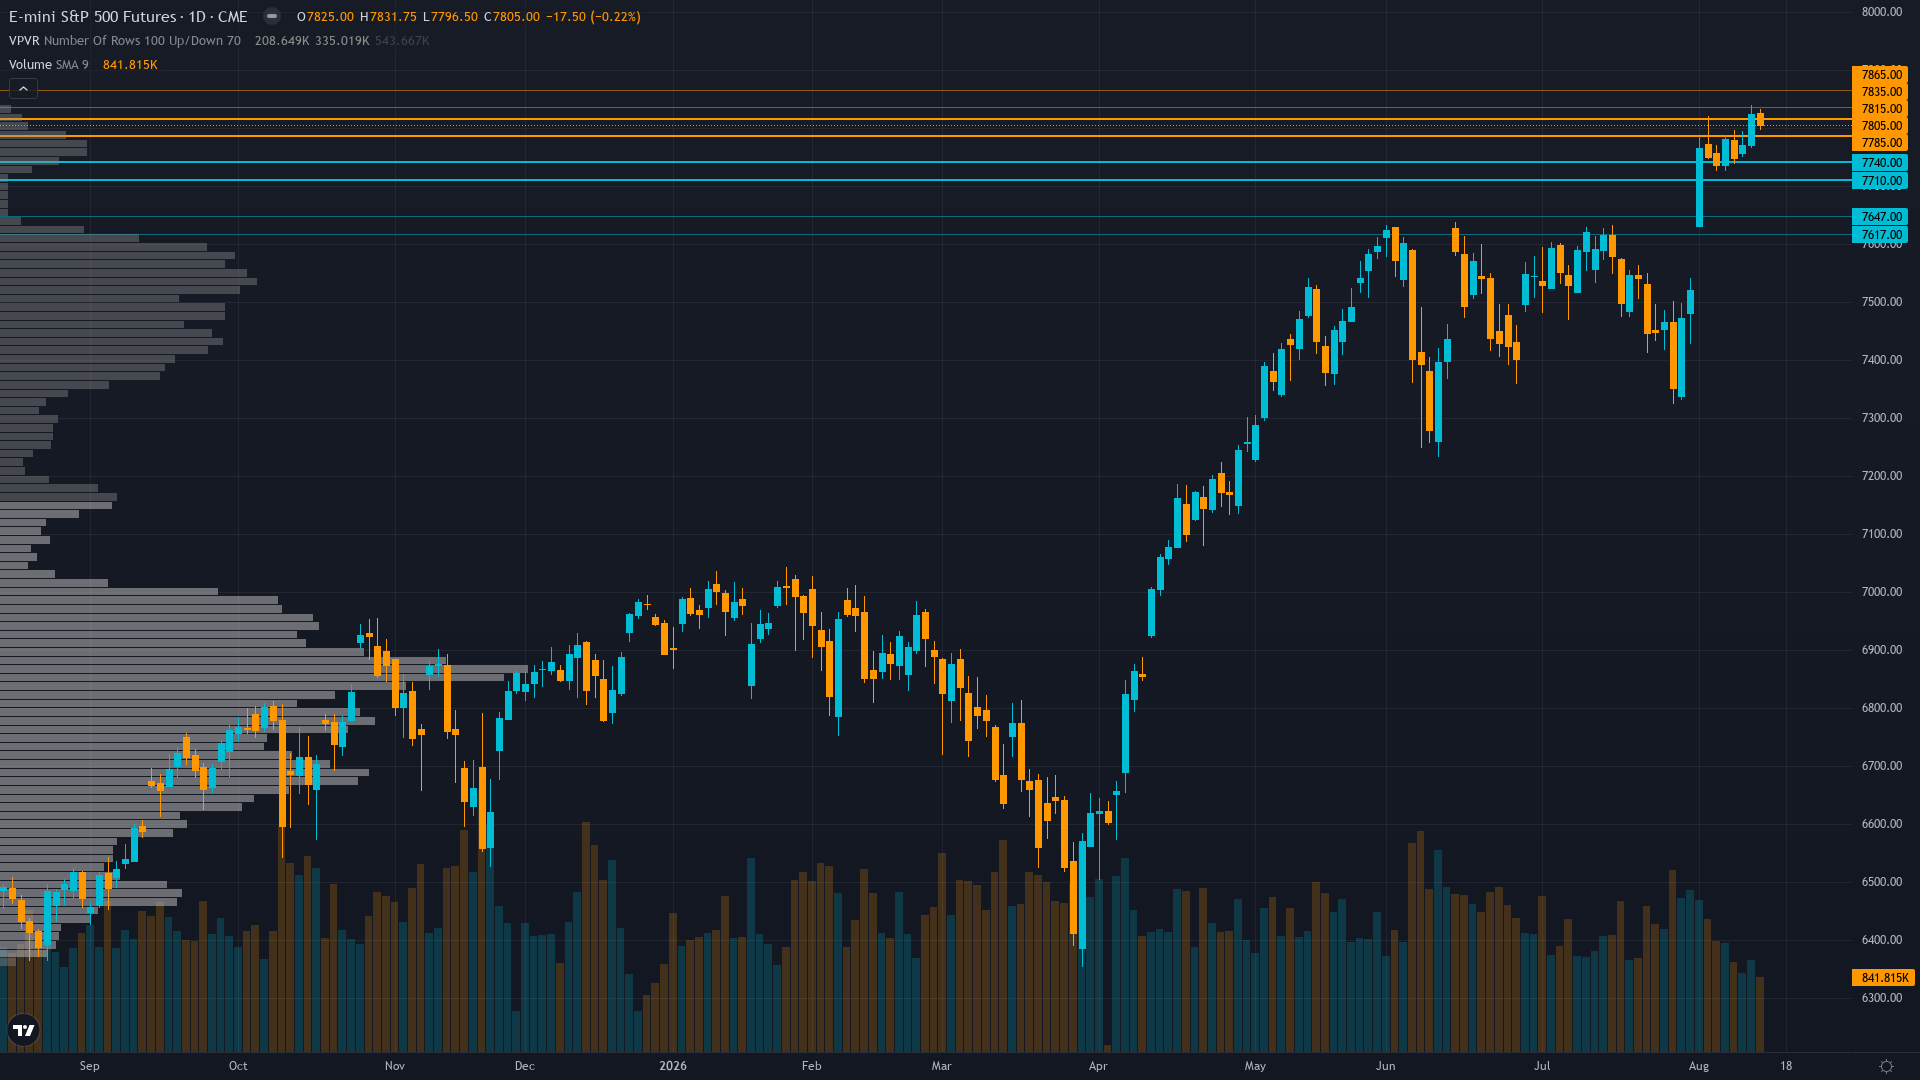
S&P 500 Forecast This Week — Outlook, Drivers & Key Levels
This week's S&P 500 outlook: key drivers, volatility context, risk-opportunity assessment and the week ahead.
This week's S&P 500 outlook: key drivers, volatility context, risk-opportunity assessment and the week ahead.
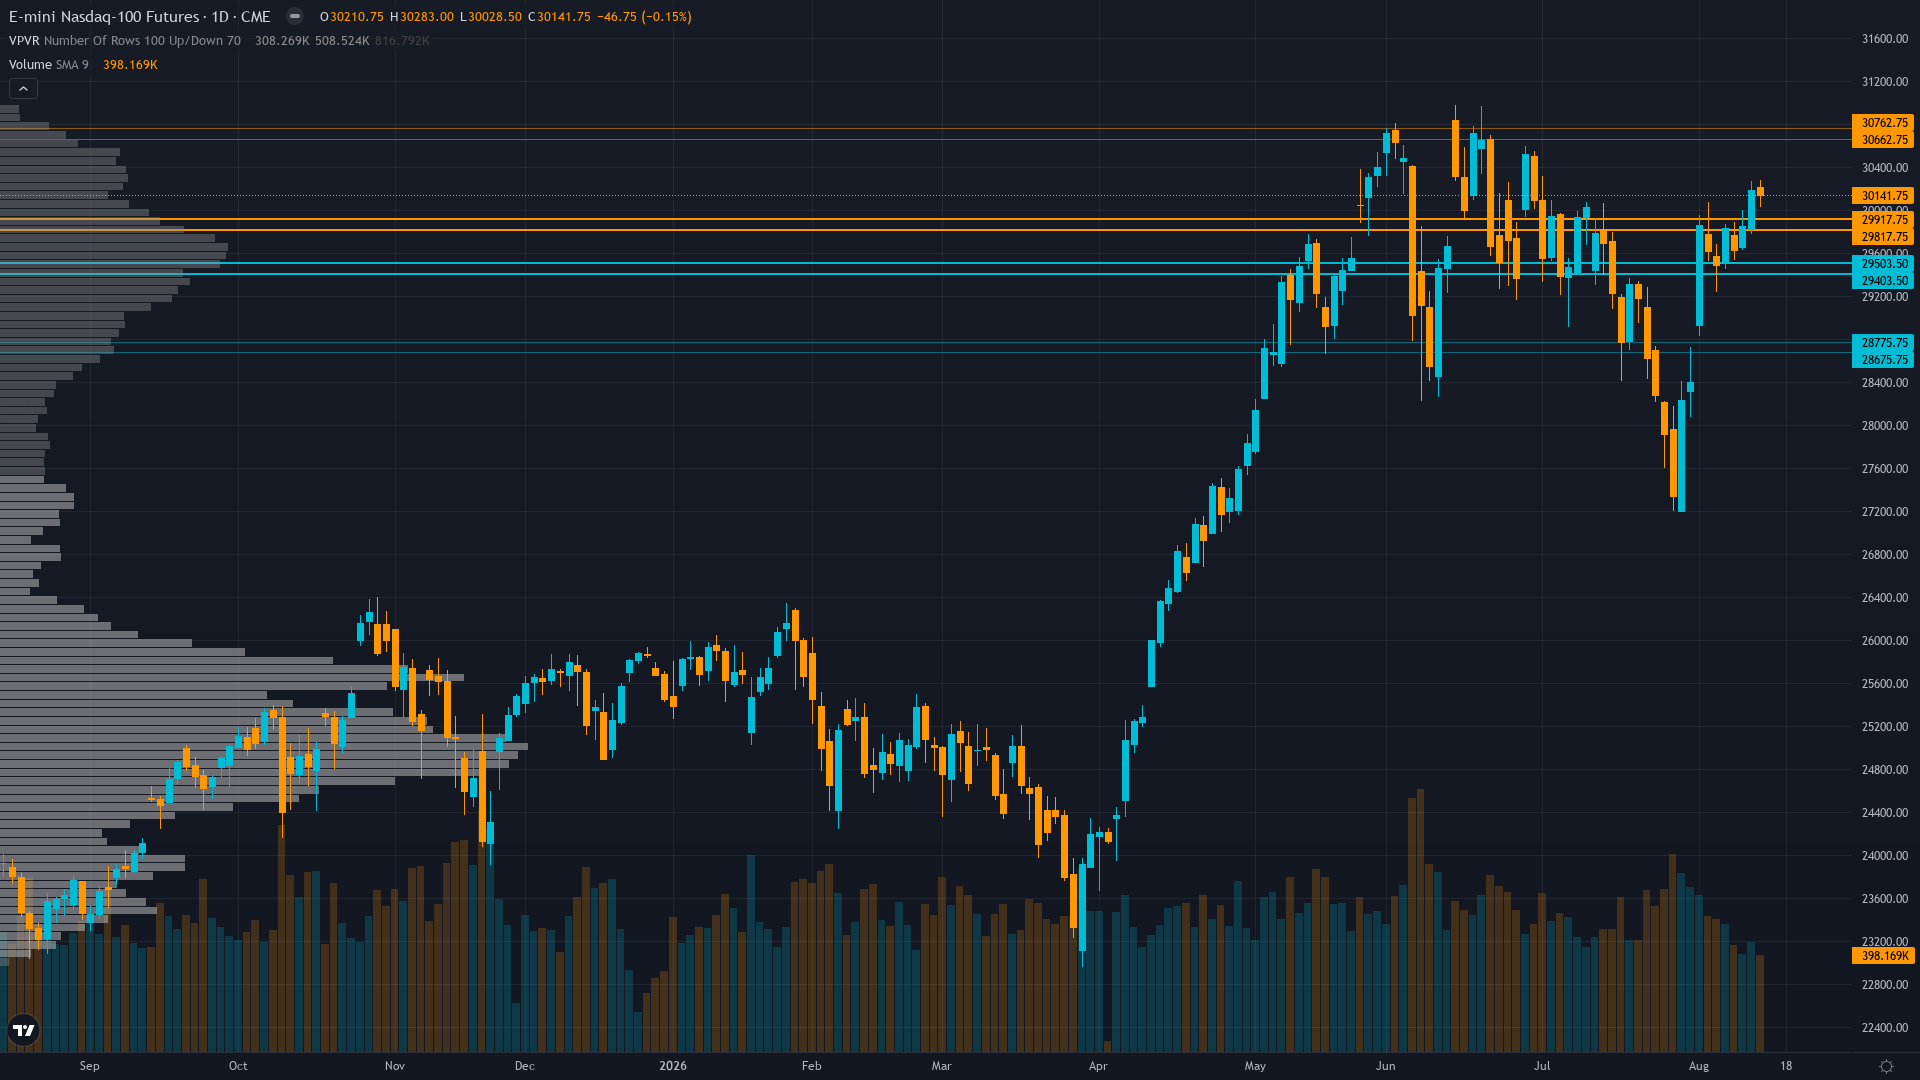
Nasdaq 100 key levels breakdown: support zones, resistance zones, confluence and price structure.
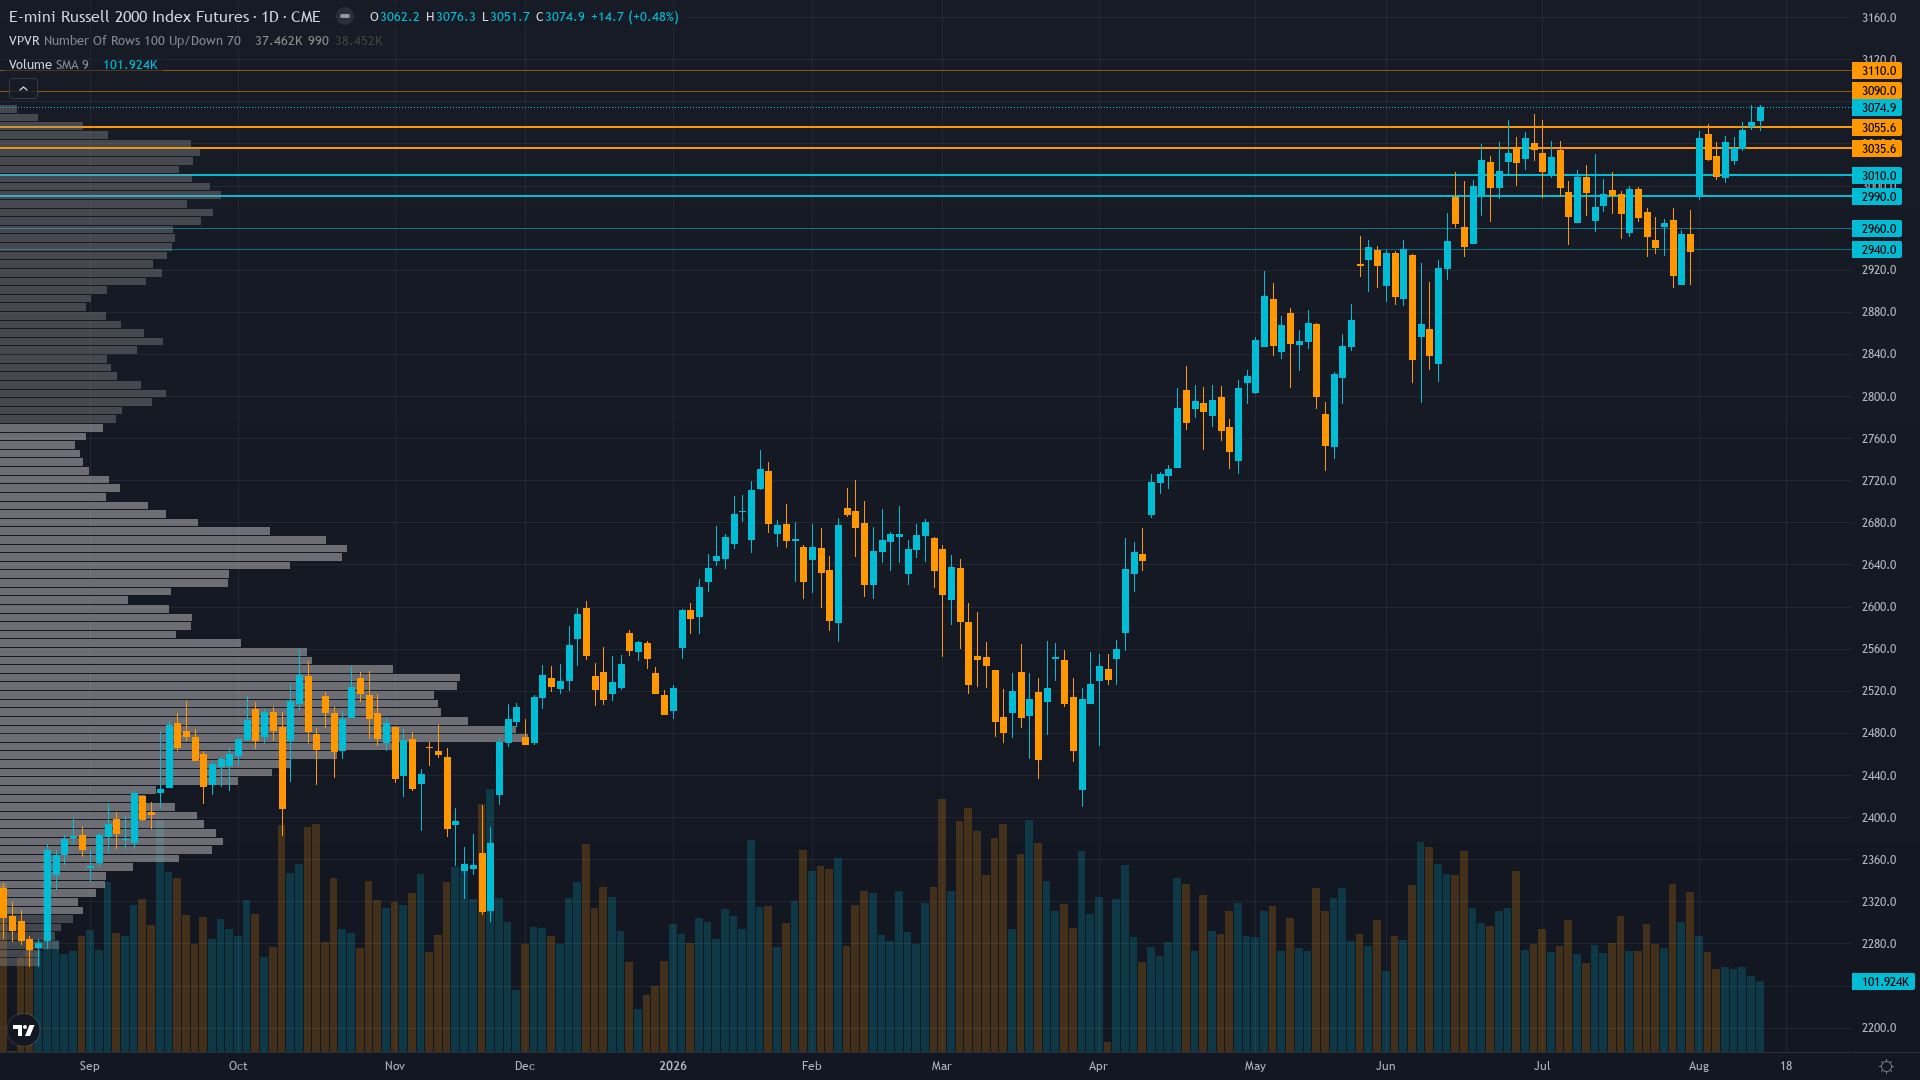
This week's Russell 2000 outlook: key drivers, volatility context, risk-opportunity assessment and the week ahead.
Russell 2000 key levels breakdown: support zones, resistance zones, confluence and price structure.
Nasdaq 100 institutional positioning: COT data, sentiment analysis and smart money flow assessment.
S&P 500 key levels breakdown: support zones, resistance zones, confluence and price structure.
This week's Nasdaq 100 outlook: key drivers, volatility context, risk-opportunity assessment and the week ahead.
Russell 2000 institutional positioning: COT data, sentiment analysis and smart money flow assessment.
S&P 500 institutional positioning: COT data, sentiment analysis and smart money flow assessment.
Russell 2000 (RTY): The market consensus is pricing a benign macro-driven continuation rally justified by valuation discounts and Fed hold expectations, but may be underappreciating the extent of institutional short positioning — non-commercial shorts have expanded to -42,304 contracts at the 28.5th
Core
Broadly constructive with consensus acknowledging stable macro (contained CPI, Fed on hold) and AI-driven earnings momentum supporting tech, while noting record COT short positioning creates binary squeeze risk and VIX complacency leaves market exposed to sentiment shocks
Core
Broadly bullish after third straight weekly gain driven by AI capex cycle and VIX compression to new lows, with S&P 500 near record highs supported by controlled inflation and earnings strength, though August seasonal weakness and overbought conditions create caution ahead of Housing Starts/Industri