Silver (SI) — Structural deficit fundamentals (sixth consecutive year with 67M oz shortfall…
Market consensus fractured between structural bulls targeting $80-90 recovery on intact sixth-year deficit fundamentals and cautious neutrals awaiting May 12 CPI and June FOMC clarity, with CoinCodex algorithm predicting +1.96% to $76.89 by May 8 suggesting modest bullish lean emerging among technic

Market consensus fractured between structural bulls targeting $80-90 recovery on intact sixth-year deficit fundamentals and cautious neutrals awaiting May 12 CPI and June FOMC clarity, with CoinCodex algorithm predicting +1.96% to $76.89 by May 8 suggesting modest bullish lean emerging among technical models
Structural deficit fundamentals (sixth consecutive year with 67M oz shortfall and 59% industrial demand) remain intact but overwhelmed near-term by monetary policy headwinds from Fed's hawkish hold at 3.50-3.75% sustaining real yields above 2.0% and DXY strength
Industrial demand deterioration emerging as TheStreet April 16 report documented fabrication demand falling to four-year low with 3% decline, suggesting high prices driving substitution and thrifting trends faster than anticipated—fundamental headwind not fully priced
Extreme retail positioning at 90% long (DailyFX data) combined with washed-out institutional positioning (managed money net long at 10,039 contracts near post-January washout levels) creates asymmetry where downside from forced liquidation limited but upside requires fresh catalyst
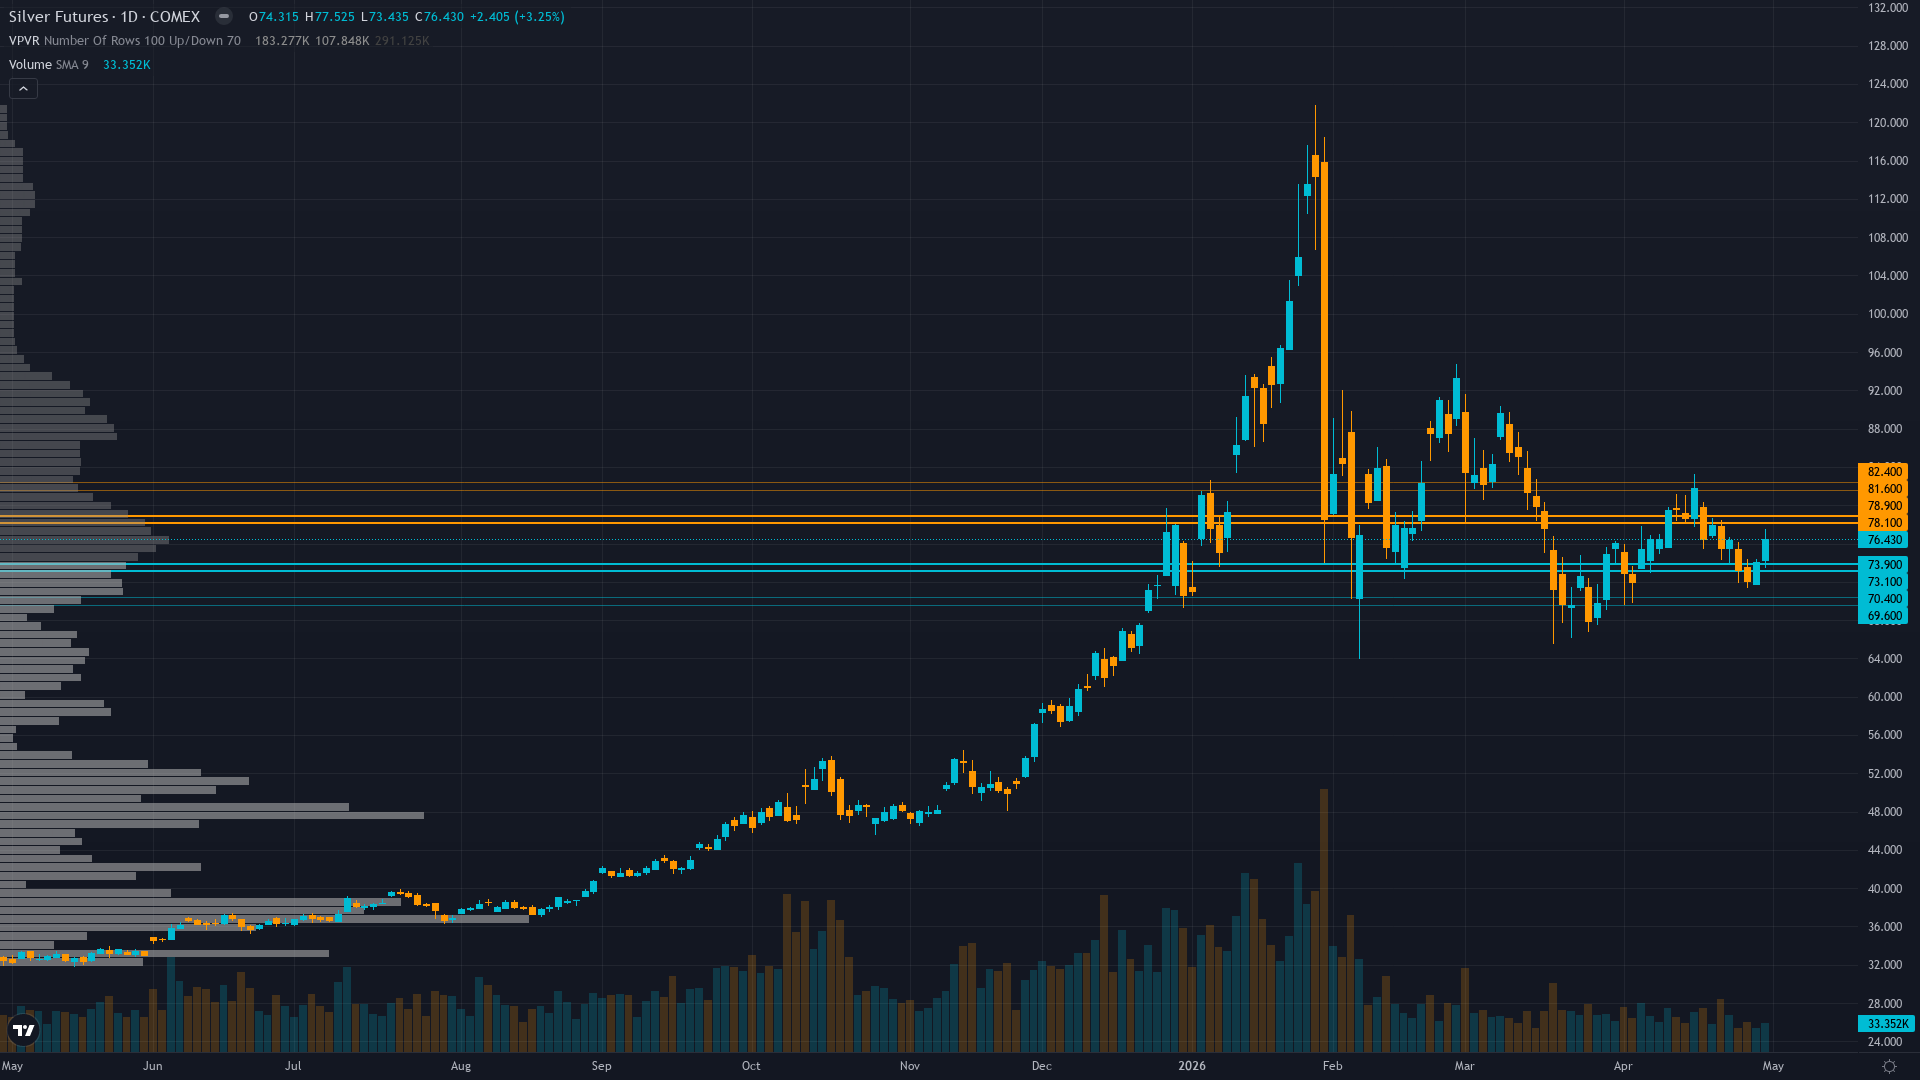
| ▼ Resistance Zone 2 | 80.50 – 83.50 |
| ▼ Resistance Zone 1 | 77.00 – 80.00 |
| ─ Pivot Area | ~76.00 |
| ▲ Support Zone 1 | 72.00 – 75.00 |
| ▲ Support Zone 2 | 68.50 – 71.50 |
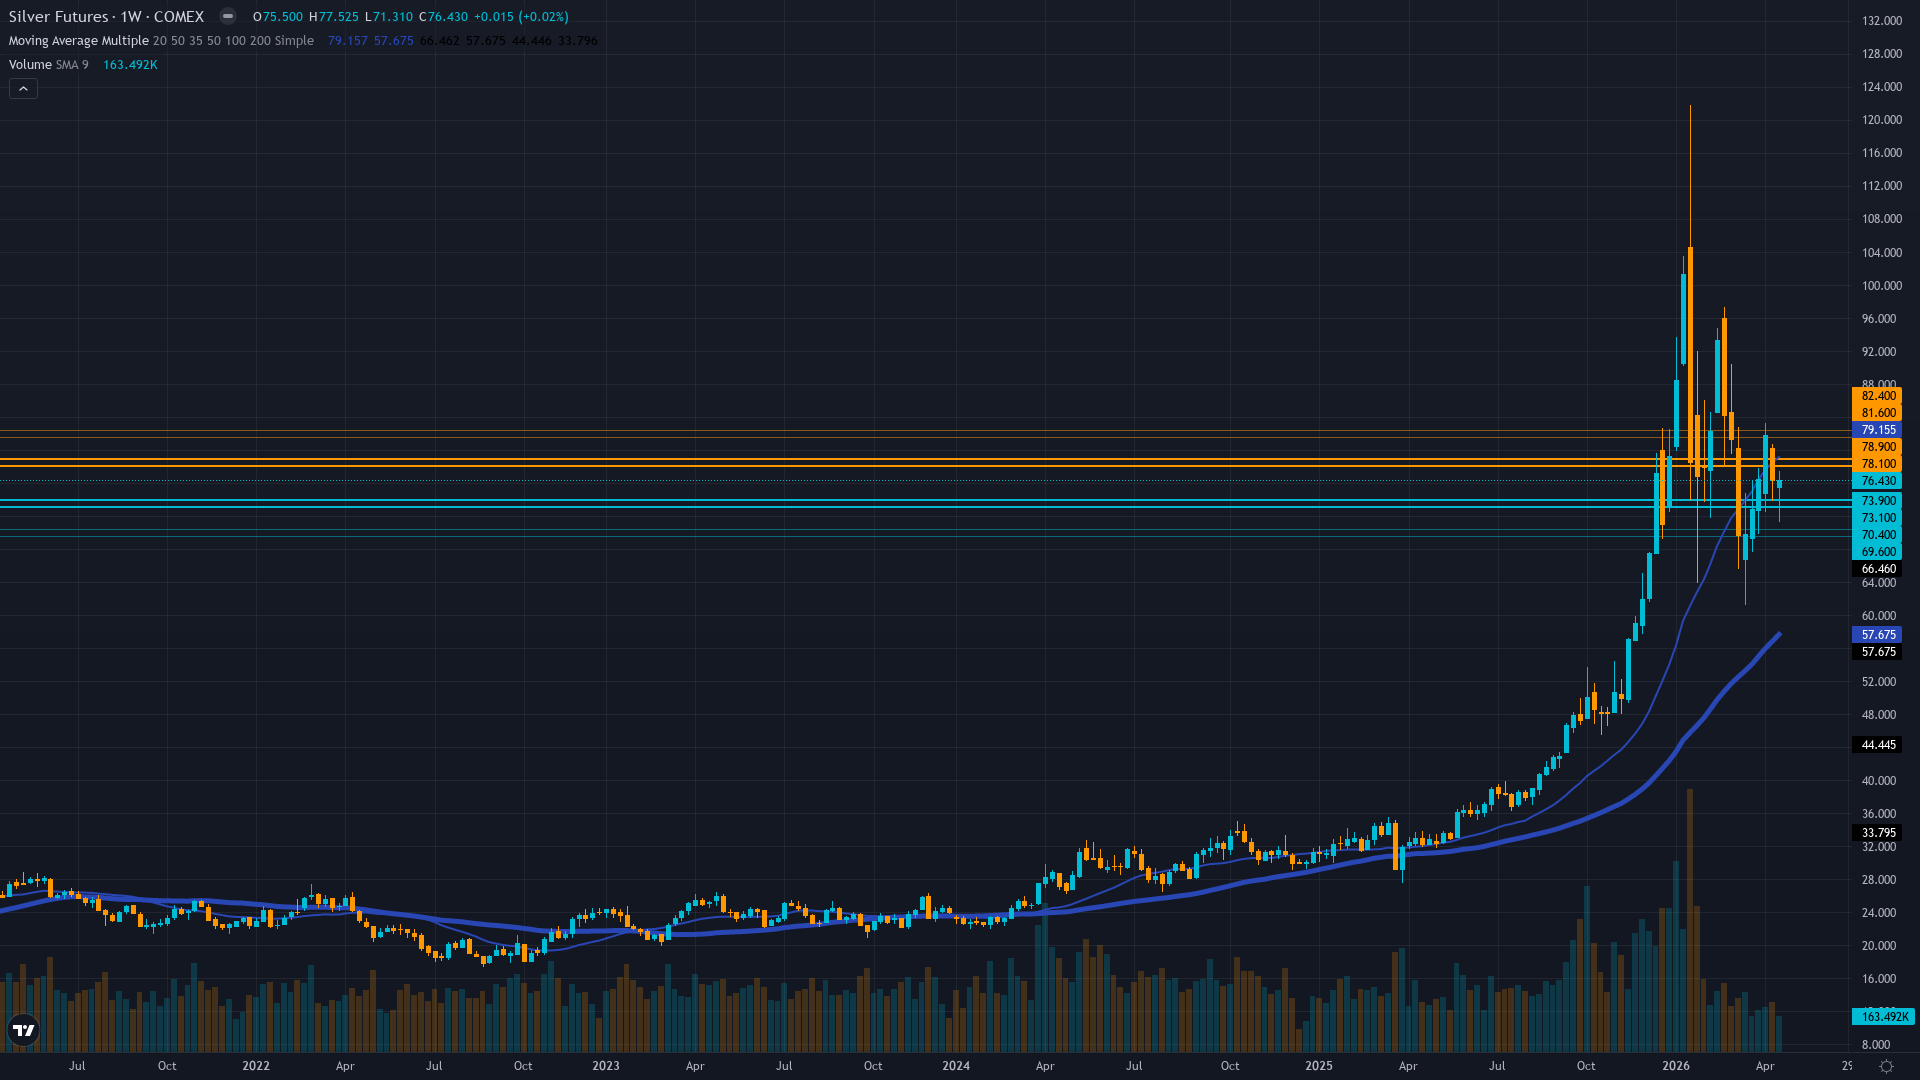
Consolidating in $73-78 range after last week's correct BEARISH call, trading below 50-day MA at $81.17 but well above 200-day near $60, RSI neutral offering no directional conviction, multiple failed recovery attempts above $82 reinforcing overhead resistance
Sixth consecutive year of 67M oz structural deficit with 59% industrial demand unchanged per Silver Institute April 15 report, but April 16 TheStreet documentation of industrial fabrication falling 3% to four-year low represents material demand deterioration headwind suggesting high prices driving substitution faster than deficit thesis assumes
Managed money net long at 10,039 contracts (down 777 contracts week-over-week per May 1 COT) representing mid-range positioning after January-March washout, SLV outflows continuing at 9.32% AUM decline but decelerating, positioning neither extreme long nor capitulation short
Implied volatility elevated at 49% (Barchart May 2026 contract data) well above normal 15-25% range reflecting continued two-way risk, put/call ratio and strike-level data insufficient for directional assessment per Options Agent, extreme volatility creates 5-7% daily ranges requiring wider risk management
Fed on hold at 3.50-3.75% after April 28-29 FOMC meeting (4 days ago on April 29) maintained hawkish stance with no rate cut signal, 10Y TIPS real yields at 1.90% creating headwind for non-yielding assets, DXY at 98.2 showing modest strength, VIX at 16.89 below 20 threshold indicating risk-on regime yet precious metals consolidating rather than rallying
Inverted - short-term volatility at 50% remains elevated above long-term 48% reflecting acute post-FOMC uncertainty with 5-7% daily ranges versus normal 2-3% as market awaits May 12 CPI inflation data creating defensive positioning and two-way risk ahead of next Fed policy inflection point
When volatility exceeds 80th percentile in 7-10 day window before major CPI releases at mid-range technical levels, historical pattern shows either sharp 6-10% directional resolution within 24-48 hours post-data if inflation surprises, or continued elevated volatility 1-2 weeks if data meets expectations—current $73-78 consolidation suggests market awaiting catalyst clarity before committing direction
High volatility at 82nd percentile typically persists through major binary events then moderates; expect continuation of elevated regime through May 12 CPI with potential moderation toward 75th percentile within 5-10 days post-release if inflation data provides clear directional signal, though persistent hawkish Fed could sustain elevated levels longer
High volatility at 82nd percentile requires stops 12-18% below entry versus normal 4-6% with daily ranges now 5-7% versus typical 2-3% making pre-CPI directional calls unreliable; breakout above $78.50 post-May 12 becomes reliable continuation signal toward $82-85 if inflation moderates enabling Fed dovish shift, while failure below $73.50 accelerates correction risk to $70-72 if inflation reaccelerates forcing Fed hawkish persistence
High volatility regime at 82nd percentile ahead of May 12 binary CPI catalyst creates potential for 8-12% single-direction move within 48 hours post-release from current $76 level toward either $84-86 if dovish inflation surprise weakens dollar (11-13% upside) or $67-70 if hawkish reacceleration drives real yields higher (9-12% downside); asymmetry currently favors waiting for directional confirmation post-CPI rather than pre-positioning given conflicting fundamental signals (deficit versus demand destruction) and last month's -7.4% MISSED call demonstrating forecast error risk in pre-catalyst environment
|
⚠️ Primary Risk
April CPI on May 12 shows inflation reacceleration above 3.2% forcing Fed to maintain restrictive stance through H2 2026, sustaining real yields above 2.0% and DXY above 100, triggering breakdown below $73.50 toward $70 psychological support as extreme retail positioning at 90% long forced to capitulate on persistent monetary policy headwinds Probability: MEDIUM
|
✦ Primary Opportunity
April CPI on May 12 shows inflation moderation to 2.8% or below enabling Fed dovish shift at June 17-18 FOMC signaling rate cut possibility, weakening dollar below DXY 96 and driving real yields below 1.80%, enabling recovery toward $80-82 resistance as sixth-year structural deficit with 59% industrial demand reasserts and washed-out institutional positioning provides upside fuel Timeframe: 2-4 weeks through May 12 CPI and into late May if inflation data cooperates and Fed signals dovish pivot at June FOMC
|
Silver stands at a critical crossroads on May 3, 2026, trading at $76 in the wake of last week's CORRECT BEARISH call (price fell -0.11% from $76 to $75.92) that validated the desk's cautious stance amid extreme volatility and binary FOMC risk. Post-input development identified: The April 28-29 FOMC meeting concluded 4 days ago with the Fed maintaining its hawkish hold at 3.50-3.75%, providing no new dovish catalyst and sustaining the dollar strength and elevated real yield environment that has capped precious metals since March.
The macro regime classification is TRANSITIONAL RISK-ON: VIX at 16.89 signals clear risk-on sentiment (well below 20 threshold), credit conditions stable, yet paradoxically precious metals are consolidating in a narrow $73-78 range rather than rallying because the Fed's sustained restrictive monetary policy with real yields at 1.90% continues to create mathematical headwind for non-yielding assets despite broader market complacency. This represents a regime where traditional correlations show partial breakdown—risk-on equity strength does not translate to precious metals strength when monetary policy remains the dominant cross-asset driver.
The critical market intelligence: silver's consolidation in the $73-78 range over the past two weeks (last week -0.11%, prior week -7.4%) represents digestion behavior following April's violent FOMC-driven selloff, but from today's vantage point on May 3, no fresh catalyst has emerged to resolve directional uncertainty. The fundamental backdrop remains paradoxically constructive yet near-term challenged: the Silver Institute's April 15 confirmation (18 days ago) of a sixth consecutive year of structural deficit at 67M oz with industrial demand consuming record 59% of supply from solar, EV, and AI sectors represents genuine physical scarcity.
However, this structural positive is being actively contradicted by TheStreet's April 16 documentation (17 days ago) that industrial fabrication demand has fallen 3% to a four-year low, driven by Iran war impact on global manufacturing and potential demand destruction at elevated price levels—this suggests the high-price environment is accelerating substitution and thrifting in industrial applications faster than the deficit thesis assumes, creating a fundamental headwind not yet fully priced. The technical structure shows silver consolidating in the $73-78 range with the 50-day MA at $81.17 representing 6.8% overhead resistance—a meaningful gap that requires either Fed dovish pivot or fresh industrial demand catalyst to overcome.
RSI neutral offers no directional conviction. The sentiment picture presents classic crowding without capitulation: DailyFX client sentiment shows retail traders heavily net-long at nearly 90%, an extreme one-sided positioning that serves as contrarian warning, yet this extreme has persisted for weeks without forcing liquidation. Institutional positioning tells opposite story—managed money net long at 10,039 contracts (down 777 week-over-week per May 1 COT) represents mid-range after January-March washout, suggesting speculative positioning has normalized.
This creates asymmetric potential: further downside from forced long liquidation is limited given washed-out institutional stance, but upside requires a catalyst to overcome both extreme retail positioning and the deteriorating industrial demand narrative documented in April. From a bias integrity perspective, last week's BEARISH call at conviction 5 was CORRECT as price moved -0.11% aligning with bearish lean, resetting miss streak to zero. Current consecutive same-direction bias streak: 2 weeks BEARISH (prior week BEARISH at conviction 5, this week continuing).
Miss streak: 0 consecutive. Bias Review Rule NOT triggered (2 weeks well below 8-week threshold). Miss Reset Rule NOT triggered. Applying Rule 4 Thesis Health Score: reviewing last 4 graded weeks shows April 24 MISSED (BULLISH -7.4%), April 17 CORRECT (BULLISH +6.64%), April 10 MISSED (NO CALL +4.96%), May 1 CORRECT (BEARISH -0.11%)—2 of 4 moved contrary to current bearish lean, but net 4-week move from April 17 Monday open $76.26 to current $76 is -0.34% or -0.06x average weekly move of 5.79%, no thesis degradation penalty applies.
The prudent directional lean is NEUTRAL with slight bearish tilt. Starting conviction 6 (acknowledging last week's correct call, structural deficit offset by demand deterioration, extreme retail positioning, no fresh catalyst this week) minus Rule 3 penalties: -0 for last call CORRECT, -1 for macro regime (neutral bias neither clearly aligns with nor opposes transitional risk-on regime where equities rally but precious metals stagnate), -0 for volatility (elevated at 82nd percentile but not extreme threshold) = conviction 5 (minimum threshold).
No catalyst occurred this week beyond the April 29 FOMC (which sustained hawkish stance as expected), and next catalyst is May 12 CPI 9 days away, placing conviction at quiet-period maximum. The probable weekly move estimation suggests $73-79 range representing potential 4-8% swing well above the 0.30% Noise Floor, making directional calls meaningful but two-way risk from binary May 12 CPI event limits conviction. A NEUTRAL signal of -0.5 (slight bearish lean acknowledging demand deterioration headwind, extreme retail positioning, Fed hawkish hold sustaining real yield pressure) at conviction 5 reflects honest assessment: the desk sees sixth-year structural deficit as medium-term constructive floor above $70-73, but near-term lacks conviction for directional bias given absence of fresh catalysts this week, binary CPI risk 9 days ahead, and the April 16 industrial demand deterioration data creating fundamental uncertainty that contradicts the deficit thesis.
This is disciplined recognition that in low-information-edge environments between major catalysts with conflicting fundamental signals (structural deficit versus demand destruction), the highest-probability outcome is to preserve credibility and maintain neutral stance until May 12 CPI resolves inflation trajectory and Fed policy clarity emerges.
| Week | Bias | Confidence | Result |
|---|---|---|---|
| May 1, 2026 | BEARISH | 5/10 | ✅ |
| April 24, 2026 | BULLISH | 7/10 | ❌ |
| April 17, 2026 | BULLISH | 6/10 | ✅ |
| April 10, 2026 | NO CALL | 5/10 | ➖ |
| April 3, 2026 | NO CALL | 5/10 | ➖ |
| March 27, 2026 | BEARISH | 6/10 | ❌ |
| March 20, 2026 | NO CALL | 5/10 | ➖ |
| March 14, 2026 | NO CALL | 5/10 | ➖ |
| March 6, 2026 | BULLISH | 7/10 | ❌ |
| February 27, 2026 | BULLISH | 7/10 | ✅ |
| February 21, 2026 | BULLISH | 7/10 | ✅ |
| February 13, 2026 | BULLISH | 7/10 | ✅ |
📋 PROMPT-READY CONTEXT
Copy this entire block into any AI chat for follow-up analysis
▼ Expand
MACRO AGENT DESK — WEEKLY INTELLIGENCE BRIEFING
═════════════════════════════════════════════════
Asset: Silver (SI)
Report Date: May 3, 2026

── DIRECTIONAL BIAS ─────────────────────────────
Call: NO CALL
Confidence: 5/10
Signal: NO DIRECTIONAL CALL THIS WEEK
MAD Index: 32 (SLIGHT DIVERGENCE)

── MARKET CONTEXT ───────────────────────────────
State: CONSOLIDATING
Regime: CONSOLIDATING WITHIN SECULAR BULL STRUCTURE FOLLOWING FED POLICY SHOCK
Sentiment: NEUTRAL

── WHAT THE MARKET SEES ─────────────────────────
Market consensus fractured between structural bulls targeting $80-90 recovery on intact sixth-year deficit fundamentals and cautious neutrals awaiting May 12 CPI and June FOMC clarity, with CoinCodex algorithm predicting +1.96% to $76.89 by May 8 suggesting modest bullish lean emerging among technical models

── WHAT THE MARKET IS MISSING ───────────────────
Market treating April 15 Silver Institute deficit confirmation and April 16 industrial demand deterioration as separate tactical issues rather than recognizing fundamental conflict—sixth year of deficit with 59% industrial demand creates structural floor above $70-73 while demand destruction from high prices (fabrication down 3% to four-year low) suggests peak pricing has triggered substitution acceleration, yet consensus models still price pure deficit thesis without incorporating demand elasticity at $75+ levels; desk recognizes this fundamental tension requires May 12 CPI catalyst to resolve but lacks conviction to call direction until binary event passes

── KEY DRIVERS ──────────────────────────────────
1. Structural deficit fundamentals (sixth consecutive year with 67M oz shortfall and 59% industrial demand) remain intact but overwhelmed near-term by monetary policy headwinds from Fed's hawkish hold at 3.50-3.75% sustaining real yields above 2.0% and DXY strength
2. Industrial demand deterioration emerging as TheStreet April 16 report documented fabrication demand falling to four-year low with 3% decline, suggesting high prices driving substitution and thrifting trends faster than anticipated—fundamental headwind not fully priced
3. Extreme retail positioning at 90% long (DailyFX data) combined with washed-out institutional positioning (managed money net long at 10,039 contracts near post-January washout levels) creates asymmetry where downside from forced liquidation limited but upside requires fresh catalyst

── KEY ZONES ────────────────────────────────────
Resistance 2: 80.50 – 83.50
Resistance 1: 77.00 – 80.00
Pivot: ~76.00
Support 1: 72.00 – 75.00
Support 2: 68.50 – 71.50

── DISCIPLINE BIASES ────────────────────────────
Technical: BEARISH
Fundamental: NO CALL
Institutional: BEARISH
Options: NO CALL
Economic: BEARISH
Sentiment: BEARISH

── TECHNICAL STRUCTURE ──────────────────────────
Consolidating in $73-78 range after last week's correct BEARISH call, trading below 50-day MA at $81.17 but well above 200-day near $60, RSI neutral offering no directional conviction, multiple failed recovery attempts above $82 reinforcing overhead resistance

── FUNDAMENTAL ASSESSMENT ───────────────────────
Sixth consecutive year of 67M oz structural deficit with 59% industrial demand unchanged per Silver Institute April 15 report, but April 16 TheStreet documentation of industrial fabrication falling 3% to four-year low represents material demand deterioration headwind suggesting high prices driving substitution faster than deficit thesis assumes

── INSTITUTIONAL POSITIONING ────────────────────
Managed money net long at 10,039 contracts (down 777 contracts week-over-week per May 1 COT) representing mid-range positioning after January-March washout, SLV outflows continuing at 9.32% AUM decline but decelerating, positioning neither extreme long nor capitulation short

── OPTIONS FLOW ─────────────────────────────────
Implied volatility elevated at 49% (Barchart May 2026 contract data) well above normal 15-25% range reflecting continued two-way risk, put/call ratio and strike-level data insufficient for directional assessment per Options Agent, extreme volatility creates 5-7% daily ranges requiring wider risk management

── ECONOMIC BACKDROP ────────────────────────────
Fed on hold at 3.50-3.75% after April 28-29 FOMC meeting (4 days ago on April 29) maintained hawkish stance with no rate cut signal, 10Y TIPS real yields at 1.90% creating headwind for non-yielding assets, DXY at 98.2 showing modest strength, VIX at 16.89 below 20 threshold indicating risk-on regime yet precious metals consolidating rather than rallying

── VOLATILITY REGIME ────────────────────────────
Regime: HIGH
Percentile: 82nd
Trend: Stable —
Days in Regime: 58
Term Structure: Inverted - short-term volatility at 50% remains elevated above long-term 48% reflecting acute post-FOMC uncertainty with 5-7% daily ranges versus normal 2-3% as market awaits May 12 CPI inflation data creating defensive positioning and two-way risk ahead of next Fed policy inflection point
Historical Pattern: When volatility exceeds 80th percentile in 7-10 day window before major CPI releases at mid-range technical levels, historical pattern shows either sharp 6-10% directional resolution within 24-48 hours post-data if inflation surprises, or continued elevated volatility 1-2 weeks if data meets expectations—current $73-78 consolidation suggests market awaiting catalyst clarity before committing direction
Outlook: High volatility at 82nd percentile typically persists through major binary events then moderates; expect continuation of elevated regime through May 12 CPI with potential moderation toward 75th percentile within 5-10 days post-release if inflation data provides clear directional signal, though persistent hawkish Fed could sustain elevated levels longer
Trading Context: High volatility at 82nd percentile requires stops 12-18% below entry versus normal 4-6% with daily ranges now 5-7% versus typical 2-3% making pre-CPI directional calls unreliable; breakout above $78.50 post-May 12 becomes reliable continuation signal toward $82-85 if inflation moderates enabling Fed dovish shift, while failure below $73.50 accelerates correction risk to $70-72 if inflation reaccelerates forcing Fed hawkish persistence
Vol Risk/Opportunity: High volatility regime at 82nd percentile ahead of May 12 binary CPI catalyst creates potential for 8-12% single-direction move within 48 hours post-release from current $76 level toward either $84-86 if dovish inflation surprise weakens dollar (11-13% upside) or $67-70 if hawkish reacceleration drives real yields higher (9-12% downside); asymmetry currently favors waiting for directional confirmation post-CPI rather than pre-positioning given conflicting fundamental signals (deficit versus demand destruction) and last month's -7.4% MISSED call demonstrating forecast error risk in pre-catalyst environment

── PRIMARY RISK ─────────────────────────────────
April CPI on May 12 shows inflation reacceleration above 3.2% forcing Fed to maintain restrictive stance through H2 2026, sustaining real yields above 2.0% and DXY above 100, triggering breakdown below $73.50 toward $70 psychological support as extreme retail positioning at 90% long forced to capitulate on persistent monetary policy headwinds
Probability: MEDIUM

── PRIMARY OPPORTUNITY ──────────────────────────
April CPI on May 12 shows inflation moderation to 2.8% or below enabling Fed dovish shift at June 17-18 FOMC signaling rate cut possibility, weakening dollar below DXY 96 and driving real yields below 1.80%, enabling recovery toward $80-82 resistance as sixth-year structural deficit with 59% industrial demand reasserts and washed-out institutional positioning provides upside fuel
Timeframe: 2-4 weeks through May 12 CPI and into late May if inflation data cooperates and Fed signals dovish pivot at June FOMC

── NEXT CATALYST ────────────────────────────────
Date: May 12, 2026
Event: April CPI release at 8:30 AM EST on May 12, 2026 (9 days away) representing critical inflation data that will shape Fed June 17-18 FOMC expectations and dollar trajectory, with consensus expecting moderation from March 3.1% spike
Expected Impact: HIGH

═══════════════════════════════════════���═════════
Source: Macro Agent Desk (macroagentdesk.com)
═════════════════════════════════════════════════

── FULL ANALYSIS ────────────────────────────────
Silver stands at a critical crossroads on May 3, 2026, trading at $76 in the wake of last week's CORRECT BEARISH call (price fell -0.11% from $76 to $75.92) that validated the desk's cautious stance amid extreme volatility and binary FOMC risk. Post-input development identified: The April 28-29 FOMC meeting concluded 4 days ago with the Fed maintaining its hawkish hold at 3.50-3.75%, providing no new dovish catalyst and sustaining the dollar strength and elevated real yield environment that has capped precious metals since March. The macro regime classification is TRANSITIONAL RISK-ON: VIX at 16.89 signals clear risk-on sentiment (well below 20 threshold), credit conditions stable, yet paradoxically precious metals are consolidating in a narrow $73-78 range rather than rallying because the Fed's sustained restrictive monetary policy with real yields at 1.90% continues to create mathematical headwind for non-yielding assets despite broader market complacency. This represents a regime where traditional correlations show partial breakdown—risk-on equity strength does not translate to precious metals strength when monetary policy remains the dominant cross-asset driver. The critical market intelligence: silver's consolidation in the $73-78 range over the past two weeks (last week -0.11%, prior week -7.4%) represents digestion behavior following April's violent FOMC-driven selloff, but from today's vantage point on May 3, no fresh catalyst has emerged to resolve directional uncertainty. The fundamental backdrop remains paradoxically constructive yet near-term challenged: the Silver Institute's April 15 confirmation (18 days ago) of a sixth consecutive year of structural deficit at 67M oz with industrial demand consuming record 59% of supply from solar, EV, and AI sectors represents genuine physical scarcity. However, this structural positive is being actively contradicted by TheStreet's April 16 documentation (17 days ago) that industrial fabrication demand has fallen 3% to a four-year low, driven by Iran war impact on global manufacturing and potential demand destruction at elevated price levels—this suggests the high-price environment is accelerating substitution and thrifting in industrial applications faster than the deficit thesis assumes, creating a fundamental headwind not yet fully priced. The technical structure shows silver consolidating in the $73-78 range with the 50-day MA at $81.17 representing 6.8% overhead resistance—a meaningful gap that requires either Fed dovish pivot or fresh industrial demand catalyst to overcome. RSI neutral offers no directional conviction. The sentiment picture presents classic crowding without capitulation: DailyFX client sentiment shows retail traders heavily net-long at nearly 90%, an extreme one-sided positioning that serves as contrarian warning, yet this extreme has persisted for weeks without forcing liquidation. Institutional positioning tells opposite story—managed money net long at 10,039 contracts (down 777 week-over-week per May 1 COT) represents mid-range after January-March washout, suggesting speculative positioning has normalized. This creates asymmetric potential: further downside from forced long liquidation is limited given washed-out institutional stance, but upside requires a catalyst to overcome both extreme retail positioning and the deteriorating industrial demand narrative documented in April. From a bias integrity perspective, last week's BEARISH call at conviction 5 was CORRECT as price moved -0.11% aligning with bearish lean, resetting miss streak to zero. Current consecutive same-direction bias streak: 2 weeks BEARISH (prior week BEARISH at conviction 5, this week continuing). Miss streak: 0 consecutive. Bias Review Rule NOT triggered (2 weeks well below 8-week threshold). Miss Reset Rule NOT triggered. Applying Rule 4 Thesis Health Score: reviewing last 4 graded weeks shows April 24 MISSED (BULLISH -7.4%), April 17 CORRECT (BULLISH +6.64%), April 10 MISSED (NO CALL +4.96%), May 1 CORRECT (BEARISH -0.11%)—2 of 4 moved contrary to current bearish lean, but net 4-week move from April 17 Monday open $76.26 to current $76 is -0.34% or -0.06x average weekly move of 5.79%, no thesis degradation penalty applies. The prudent directional lean is NEUTRAL with slight bearish tilt. Starting conviction 6 (acknowledging last week's correct call, structural deficit offset by demand deterioration, extreme retail positioning, no fresh catalyst this week) minus Rule 3 penalties: -0 for last call CORRECT, -1 for macro regime (neutral bias neither clearly aligns with nor opposes transitional risk-on regime where equities rally but precious metals stagnate), -0 for volatility (elevated at 82nd percentile but not extreme threshold) = conviction 5 (minimum threshold). No catalyst occurred this week beyond the April 29 FOMC (which sustained hawkish stance as expected), and next catalyst is May 12 CPI 9 days away, placing conviction at quiet-period maximum. The probable weekly move estimation suggests $73-79 range representing potential 4-8% swing well above the 0.30% Noise Floor, making directional calls meaningful but two-way risk from binary May 12 CPI event limits conviction. A NEUTRAL signal of -0.5 (slight bearish lean acknowledging demand deterioration headwind, extreme retail positioning, Fed hawkish hold sustaining real yield pressure) at conviction 5 reflects honest assessment: the desk sees sixth-year structural deficit as medium-term constructive floor above $70-73, but near-term lacks conviction for directional bias given absence of fresh catalysts this week, binary CPI risk 9 days ahead, and the April 16 industrial demand deterioration data creating fundamental uncertainty that contradicts the deficit thesis. This is disciplined recognition that in low-information-edge environments between major catalysts with conflicting fundamental signals (structural deficit versus demand destruction), the highest-probability outcome is to preserve credibility and maintain neutral stance until May 12 CPI resolves inflation trajectory and Fed policy clarity emerges.


