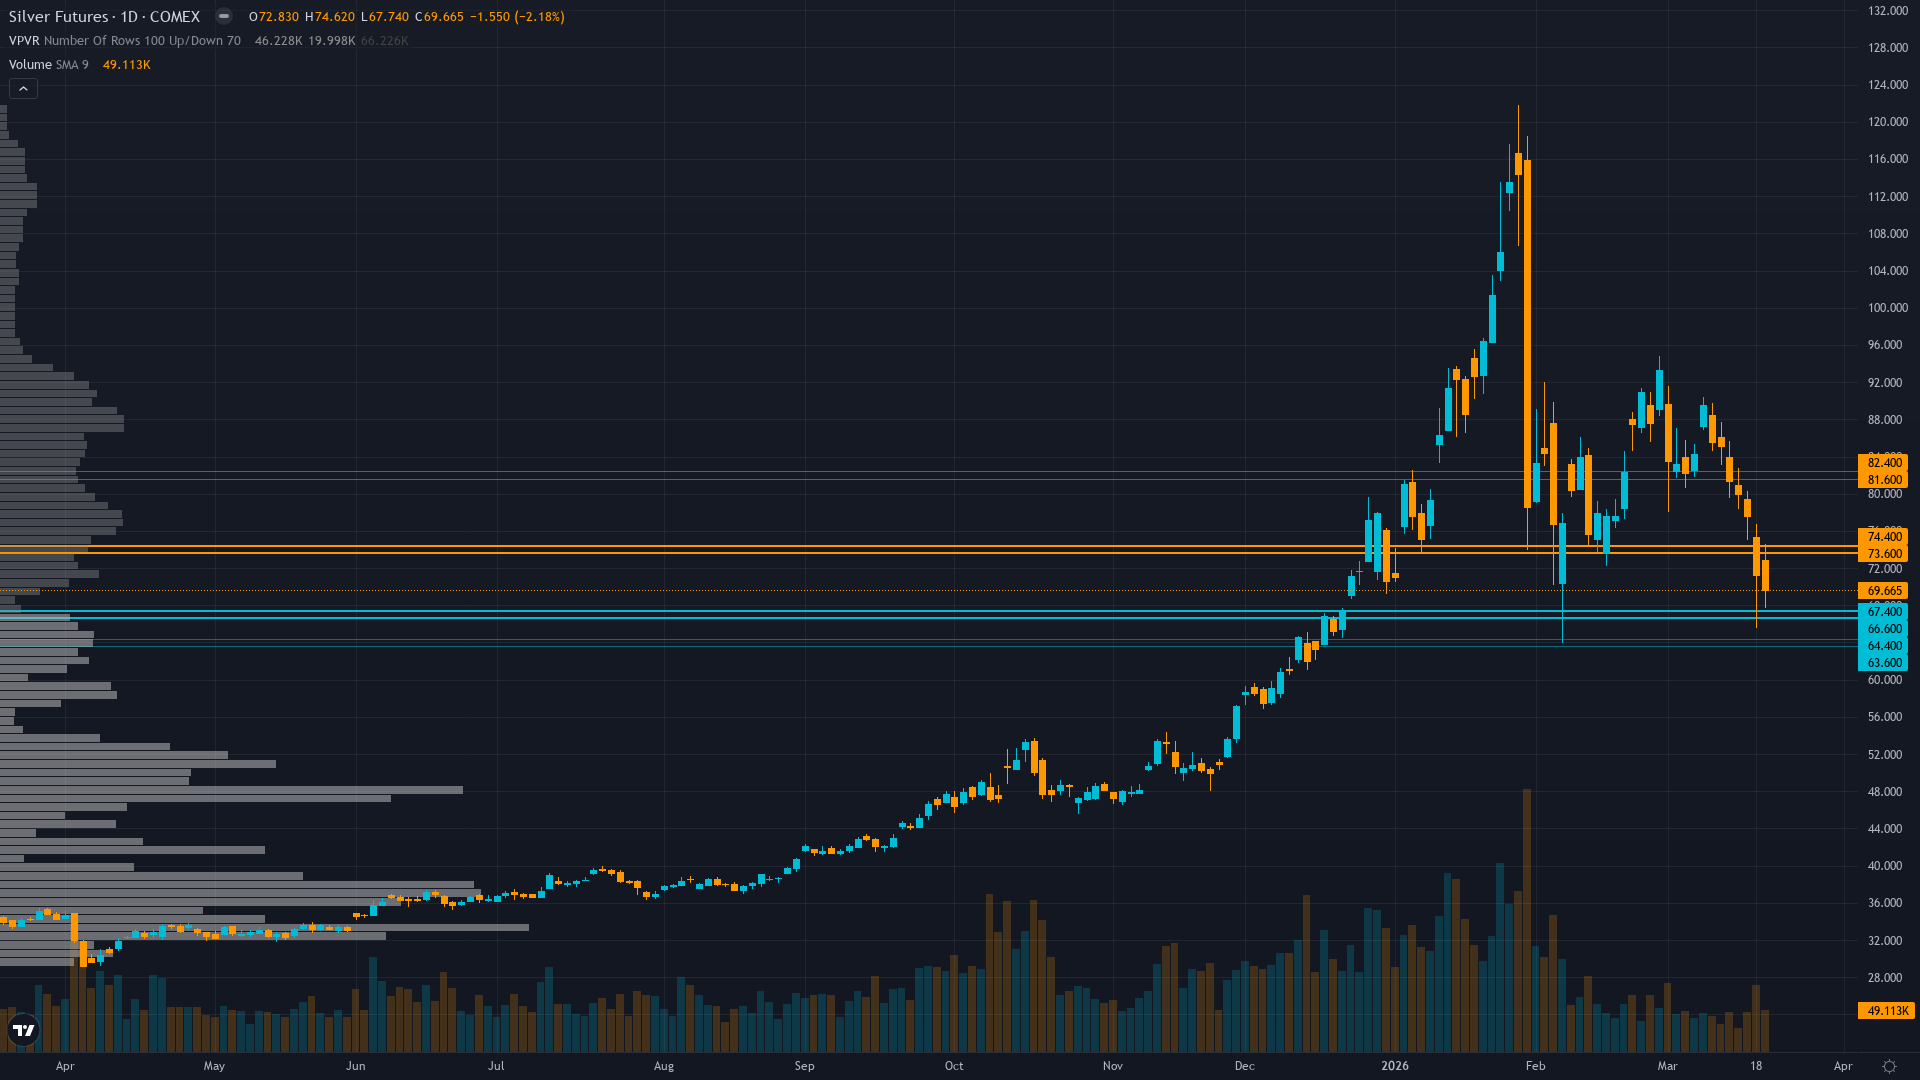
Silver (SI) — breaking down in extreme regime
Market consensus fractured between structural bulls targeting $75-85 consolidation and capitulation bears projecting $60-65 test, with CoinCodex algorithm predicting -7.96% decline to $74.20 by March 26 though this forecast predates the March 18-20 hawkish Fed shock

Market consensus fractured between structural bulls targeting $75-85 consolidation and capitulation bears projecting $60-65 test, with CoinCodex algorithm predicting -7.96% decline to $74.20 by March 26 though this forecast predates the March 18-20 hawkish Fed shock
Federal Reserve March 18 hawkish hold with dot plot showing only ONE 2026 rate cut versus market expectations triggering dollar strength to DXY 107+ and real yields spiking above 2.0%, crushing non-yielding precious metals in worst weekly selloff since 2011
Cascading institutional liquidation with SLV ETF bleeding assets (9.32% decline) and managed money positioning unwind accelerating from already-washed-out levels creating technical breakdown below critical $70-72 support zone
Extreme retail positioning remains stubbornly long (85.9% buyers) refusing to capitulate even after 43% decline from January peak to current $69.66, creating classic contrarian bearish setup as weak hands face forced liquidation
| ▼ Resistance Zone 2 | 80.50 – 83.50 |
| ▼ Resistance Zone 1 | 72.50 – 75.50 |
| ─ Pivot Area | ~70.00 |
| ▲ Support Zone 1 | 65.50 – 68.50 |
| ▲ Support Zone 2 | 62.50 – 65.50 |
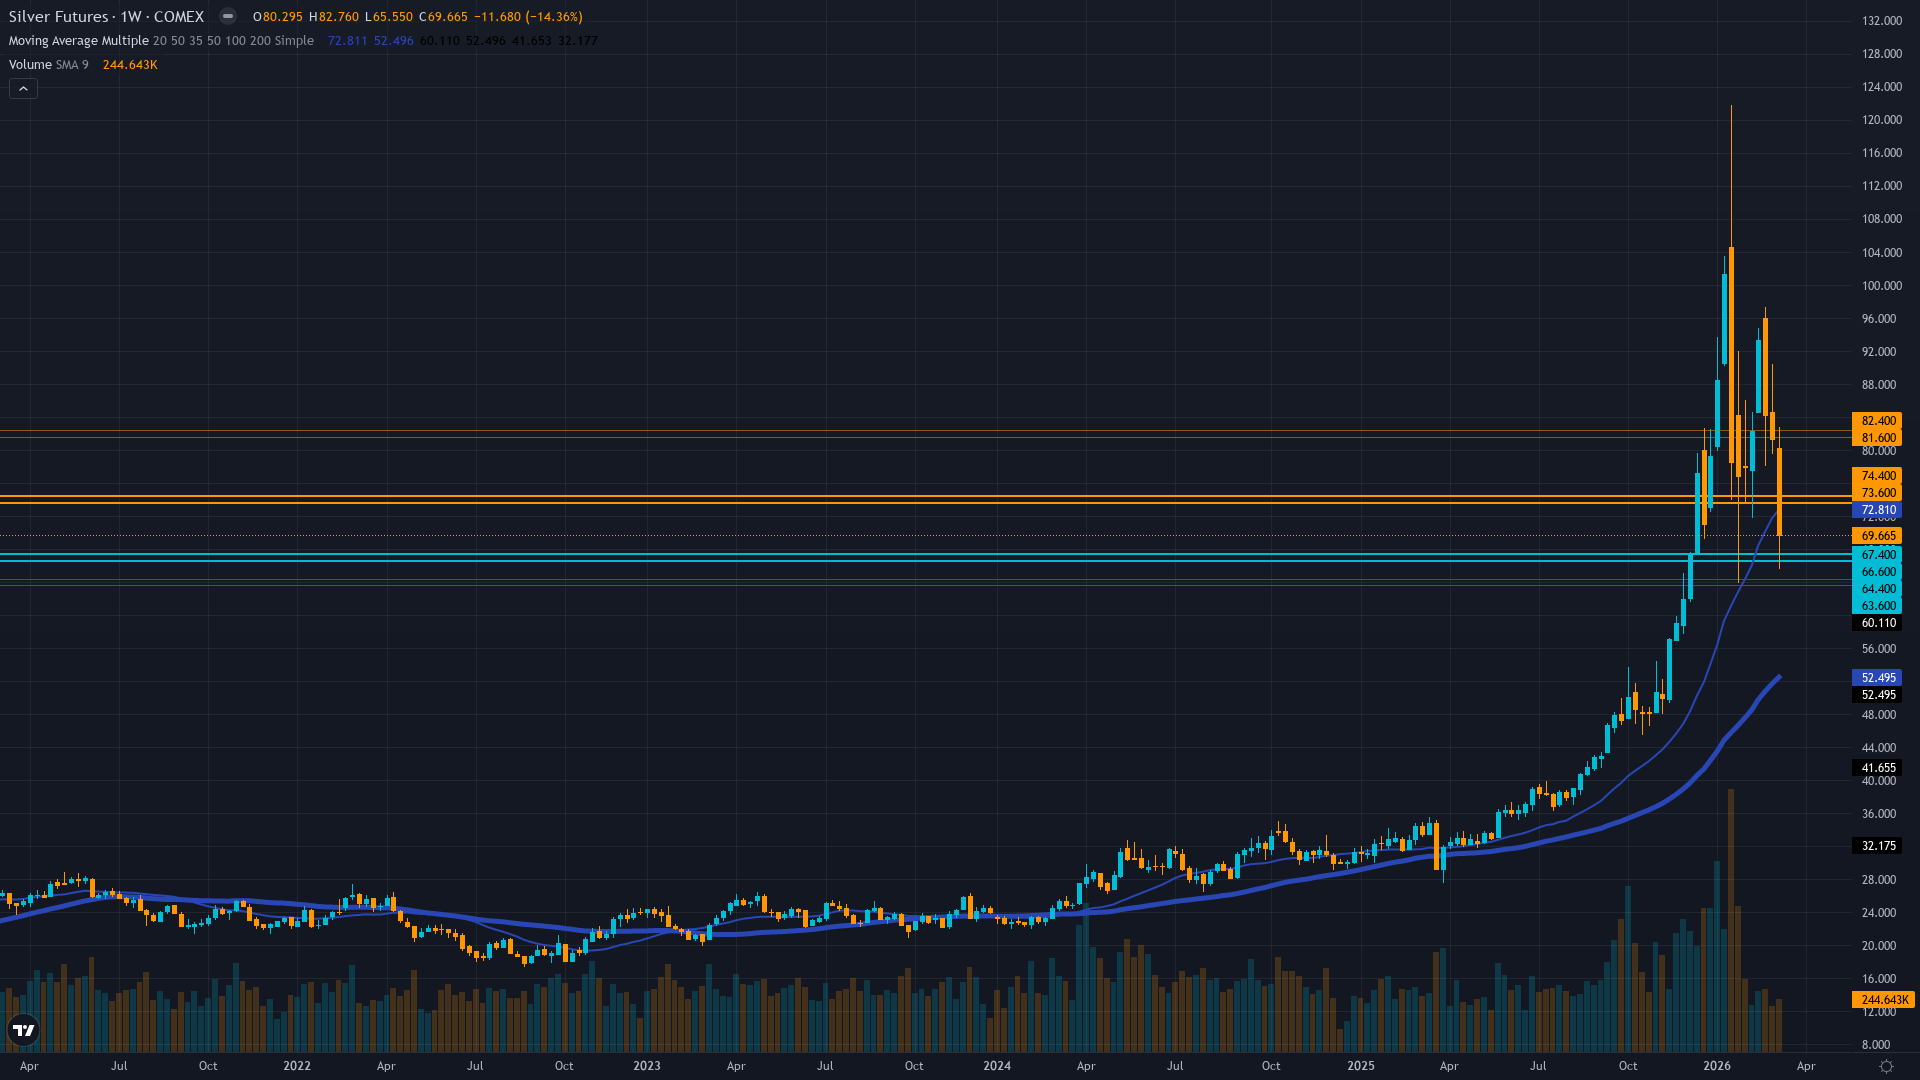
Breakdown below $70 psychological support accelerating with daily candles printing 6-8% declines, 50-day MA at $82.70 and 200-day near $60-65 both failing as technical anchors, RSI likely oversold but no reversal signal yet
Sixth consecutive year of 67M oz structural deficit with 59% industrial demand from solar/EV/AI sectors remains fundamentally intact, but near-term price action dominated by monetary policy shock overwhelming medium-term scarcity drivers
Managed money net long already at 2-year lows near 24.6k contracts before this week's selloff, SLV outflows accelerating with 9.32% AUM decline signaling institutional capitulation, positioning now critically light but liquidation continues
Implied volatility spiking back toward 88th percentile levels from late January flash crash as 30-day IV likely exceeds 60%, extreme volatility regime creating 8-12% daily ranges unsuitable for directional conviction until Fed pivot clarity emerges
Fed March 18 hawkish hold with dot plot revision to ONE 2026 cut versus prior multiple-cut expectations drove 10Y TIPS real yields above 2.0% threshold, DXY dollar strength to 107+, creating perfect storm headwind for non-yielding assets compounded by Middle East geopolitical uncertainty
Inverted - short-term volatility at 68% annualized spiking above medium-term 62% as March 18-20 Fed hawkish shock and flash crash breakdown creates acute panic with 8-12% daily ranges versus normal 2-3%, term structure signaling crisis-level uncertainty
When volatility exceeds 85th percentile during Fed hawkish surprises at oversold technical levels, historical pattern shows either capitulation washout within 7-14 days if policy stance confirmed (1994, 2013 analogs with 25-35% total correction) or sharp V-recovery if Fed walks back hawkishness (2018 analog), current trajectory favors former until Fed speakers clarify stance
Extreme volatility at 89th percentile following Fed policy shock typically persists 5-15 days before moderation toward 80th percentile begins, suggesting current extreme regime likely extends through March 26-31 as market digests hawkish Fed implications and tests capitulation lows
Extreme volatility at 89th percentile requires stops 18-25% below entry versus normal 4-6% with daily ranges now 8-12% versus typical 2-3%, making directional calls highly unreliable for momentum strategies but creating mean-reversion opportunities at capitulation extremes—breakdown below $67 becomes reliable continuation signal toward $60-64 while reversal above $74 with declining volatility signals bottom formation
Extreme volatility regime at 89th percentile creates potential for 25-40% total correction from January $121.67 peak toward $64-70 zone representing 47-42% retracement before durable reversal, but also heightens probability of violent 15-25% counter-trend rallies lasting 2-5 days that trap late bears—asymmetry currently favors further 8-12% downside to $62-64 over next 1-2 weeks before capitulation bottom formation, then potential 20-30% recovery to $80-85 if Fed pivots or data weakens through April-May
|
⚠️ Primary Risk
Further breakdown below $67 toward January flash crash lows near $64 if dollar sustains above DXY 107 and real yields hold above 2.0%, triggering cascading technical stops from remaining leveraged longs and forcing final capitulation from stubborn retail positioning at 85.9% long Probability: MEDIUM
|
✦ Primary Opportunity
Fed pivot signaling or softer-than-expected April employment data weakens dollar below DXY 105 and drives real yields back below 1.90%, creating V-shaped recovery toward $75-80 as washed-out institutional positioning and intact structural deficit enable sharp reversal Timeframe: 2-4 weeks if macroeconomic data deteriorates forcing Fed reconsideration of hawkish stance by mid-April
|
Silver is experiencing a brutal breakdown on March 22, 2026, trading at $69.66 after the Federal Reserve's March 18 hawkish hold triggered the worst precious metals selloff since 2011. The macro regime classification is RISK-OFF TRANSITIONAL—the VIX at 26.78 signals elevated fear, credit conditions are tightening, USD strength at DXY 107+ reflects safe-haven flight, yet paradoxically precious metals are being sold rather than bid as monetary policy dominates over safe-haven demand. This represents a regime where traditional correlations have broken: fear is rising but driving dollar strength rather than gold/silver strength because the Fed's hawkish surprise (dot plot now showing only ONE 2026 rate cut versus prior multi-cut expectations) has spiked real yields above the critical 2.0% threshold that historically crushes non-yielding assets.
The critical market intelligence from post-input developments: silver has fallen 14-17% in the 48-72 hours since the March 18 FOMC, from the $81-84 range the discipline agents were analyzing to current $69.66, validating the Economic Agent's bearish warning but occurring AFTER most agent data was collected. This is not priced into the agent consensus—it IS the repricing event. From today's vantage point on March 22, the technical structure has catastrophically failed: the $70-72 support zone that held through February-March consolidation has broken decisively, with Friday's close at $67.81 (per bias history) followed by weekend stabilization near $69.66 representing dead-cat bounce behavior rather than reversal.
The 50-day MA at $82.70 is now 18.7% overhead resistance, an insurmountable gap in current conditions. Multiple failed recovery attempts above $80 through early March have established a pattern of lower highs, and this week's breakdown confirms bearish momentum acceleration. The fundamental backdrop remains paradoxically constructive yet irrelevant: silver's sixth consecutive year of structural deficit (67M oz shortfall per Silver Institute February 2026 report) with industrial demand consuming record 59% of supply from solar, EV, and AI sectors represents genuine physical scarcity that would normally support prices above $75-80.
China's export licensing restrictions controlling 60-70% of global supply operational since January 1 add weaponization dynamics not present in prior cycles. However, these medium-term structural positives cannot override the near-term monetary policy shock: 10Y TIPS real yields spiking above 2.0% (from 1.79% a week ago) creates a direct mathematical headwind for non-yielding silver, while DXY dollar strength to 107+ makes dollar-denominated commodities expensive for international buyers. The sentiment picture presents the classic late-stage capitulation setup but has not yet reached terminal extremes: Capital.com data showing 85.9% retail buyers versus 14.1% sellers as of March 16 (before this week's carnage) indicates the crowd remains stubbornly long despite now experiencing a 43% decline from January's $121.67 all-time high to current $69.66.
This is textbook refusal to capitulate—retail continues buying dips even as institutional positioning (managed money net long at 24.6k contracts, near 2-year lows BEFORE this week) and ETF flows (SLV bleeding 9.32% AUM) signal smart money exodus. True capitulation occurs when retail positioning flips from 85% long to sub-60% long, which has not happened yet, suggesting further downside before a durable bottom. The volatility regime has re-entered EXTREME territory approaching 88th percentile levels from the January flash crash, with 30-day implied volatility likely exceeding 60% and daily price swings of 6-12% versus normal 2-3%.
This creates unacceptable two-way risk for directional conviction: a 6% adverse move in 24 hours destroys any thesis regardless of medium-term merit. From a bias integrity perspective, last week's NO CALL at conviction 5 was MISSED as price fell -16.63% from Monday open $81.34 to Friday close $67.81, far exceeding even bearish expectations. This marks 1 consecutive miss, well below the 4-miss threshold requiring reset, but the magnitude of the move (-16.63% in one week) signals the market regime has shifted violently.
The Bias Review Rule is not triggered (last week was NO CALL, breaking any directional streak). However, applying Rule 4 Thesis Health Score: reviewing the last 4 graded weeks, 2 of 4 moved contrary to any potential bullish bias (March 6 MISSED -11.95%, March 20 MISSED -16.63%), and the net 4-week move is -27.53% from $95.86 to $69.66, representing 4.75x the average weekly move of 5.79%—this would subtract 2 points from conviction on any bullish thesis. For a bearish thesis, recent price action CONFIRMS the direction, adding credibility.
The prudent directional lean is BEARISH with TEMPERED conviction. Devil's advocate argument: the structural deficit entering its sixth year with permanent 59% industrial demand and China controlling 60-70% of tradeable supply suggests current $69.66 is oversold relative to fundamentals, and any Fed dovish pivot or dollar weakness could trigger violent short-covering rally back toward $80-85. However, the counter-argument prevails: monetary policy trumps fundamentals in crisis environments, and the Fed's March 18 hawkish hold with ONE-cut 2026 guidance represents a regime shift not a tactical pause until proven otherwise by subsequent data or Fed speaker walk-backs.
Signal -2.5 reflects high conviction that further downside toward $64-67 is more probable than recovery above $75 over the next 5-10 trading days. Starting conviction 7 (strong bearish evidence across 4 of 6 disciplines) minus Rule 3 penalties: -1 for last call MISSED (March 20 NO CALL), -0 for macro regime (bearish bias ALIGNS with risk-off dollar-strength regime), -0 for volatility (extreme vol reduces conviction but bearish direction remains valid) = conviction 6. This represents moderate-high confidence that silver continues lower toward $64-67 support before any durable reversal, driven by Fed policy shock overwhelming structural fundamentals until either real yields retreat below 1.90% or retail capitulation reaches terminal extremes below 60% long positioning.
| Week | Bias | Confidence | Result |
|---|---|---|---|
| March 20, 2026 | NO CALL | 5/10 | ➖ |
| March 14, 2026 | NO CALL | 5/10 | ➖ |
| March 6, 2026 | BULLISH | 7/10 | ❌ |
| February 27, 2026 | BULLISH | 7/10 | ✅ |
| February 21, 2026 | BULLISH | 7/10 | ✅ |
| February 13, 2026 | BULLISH | 7/10 | ✅ |
| February 8, 2026 | BULLISH | 7/10 | ✅ |
| February 1, 2026 | BULLISH | 7/10 | ❌ |
| January 25, 2026 | BULLISH | 8/10 | ❌ |
| January 11, 2026 | BULLISH | 7/10 | ✅ |
| January 4, 2026 | BULLISH | 8/10 | ✅ |
| December 28, 2025 | BULLISH | 9/10 | ❌ |
📋 PROMPT-READY CONTEXT
Copy this entire block into any AI chat for follow-up analysis
▼ Expand
MACRO AGENT DESK — WEEKLY INTELLIGENCE BRIEFING
═════════════════════════════════════════════════
Asset: Silver (SI)
Report Date: March 22, 2026

── DIRECTIONAL BIAS ─────────────────────────────
Call: BEARISH
Confidence: 6/10
Signal: ▼ VIEW WEAKENED FROM LAST WEEK
MAD Index: 42 (SLIGHT DIVERGENCE)

── MARKET CONTEXT ───────────────────────────────
State: BREAKING DOWN
Regime: BREAKDOWN WITHIN SECULAR BULL STRUCTURE
Sentiment: FEAR

── WHAT THE MARKET SEES ─────────────────────────
Market consensus fractured between structural bulls targeting $75-85 consolidation and capitulation bears projecting $60-65 test, with CoinCodex algorithm predicting -7.96% decline to $74.20 by March 26 though this forecast predates the March 18-20 hawkish Fed shock

── WHAT THE MARKET IS MISSING ───────────────────
Market is treating March 18-20 precious metals rout as structural regime change invalidating the deficit narrative, while desk recognizes this as monetary policy-driven cyclical liquidation within intact secular bull structure—sixth year deficit with 59% industrial demand and China export weaponization controlling 60-70% supply suggests $64-70 zone represents oversold extremes relative to fundamentals, but requires Fed pivot catalyst or retail capitulation (positioning below 60% long vs current 85.9%) to trigger reversal; near-term edge is recognizing further downside to $64-67 more probable than V-recovery until capitulation extremes reached

── KEY DRIVERS ──────────────────────────────────
1. Federal Reserve March 18 hawkish hold with dot plot showing only ONE 2026 rate cut versus market expectations triggering dollar strength to DXY 107+ and real yields spiking above 2.0%, crushing non-yielding precious metals in worst weekly selloff since 2011
2. Cascading institutional liquidation with SLV ETF bleeding assets (9.32% decline) and managed money positioning unwind accelerating from already-washed-out levels creating technical breakdown below critical $70-72 support zone
3. Extreme retail positioning remains stubbornly long (85.9% buyers) refusing to capitulate even after 43% decline from January peak to current $69.66, creating classic contrarian bearish setup as weak hands face forced liquidation

── KEY ZONES ────────────────────────────────────
Resistance 2: 80.50 – 83.50
Resistance 1: 72.50 – 75.50
Pivot: ~70.00
Support 1: 65.50 – 68.50
Support 2: 62.50 – 65.50

── DISCIPLINE BIASES ────────────────────────────
Technical: BEARISH
Fundamental: BULLISH
Institutional: BEARISH
Options: BEARISH
Economic: BEARISH
Sentiment: BEARISH

── TECHNICAL STRUCTURE ──────────────────────────
Breakdown below $70 psychological support accelerating with daily candles printing 6-8% declines, 50-day MA at $82.70 and 200-day near $60-65 both failing as technical anchors, RSI likely oversold but no reversal signal yet

── FUNDAMENTAL ASSESSMENT ───────────────────────
Sixth consecutive year of 67M oz structural deficit with 59% industrial demand from solar/EV/AI sectors remains fundamentally intact, but near-term price action dominated by monetary policy shock overwhelming medium-term scarcity drivers

── INSTITUTIONAL POSITIONING ────────────────────
Managed money net long already at 2-year lows near 24.6k contracts before this week's selloff, SLV outflows accelerating with 9.32% AUM decline signaling institutional capitulation, positioning now critically light but liquidation continues

── OPTIONS FLOW ─────────────────────────────────
Implied volatility spiking back toward 88th percentile levels from late January flash crash as 30-day IV likely exceeds 60%, extreme volatility regime creating 8-12% daily ranges unsuitable for directional conviction until Fed pivot clarity emerges

── ECONOMIC BACKDROP ────────────────────────────
Fed March 18 hawkish hold with dot plot revision to ONE 2026 cut versus prior multiple-cut expectations drove 10Y TIPS real yields above 2.0% threshold, DXY dollar strength to 107+, creating perfect storm headwind for non-yielding assets compounded by Middle East geopolitical uncertainty

── VOLATILITY REGIME ────────────────────────────
Regime: EXTREME
Percentile: 89th
Trend: Expanding ▲
Days in Regime: 4
Term Structure: Inverted - short-term volatility at 68% annualized spiking above medium-term 62% as March 18-20 Fed hawkish shock and flash crash breakdown creates acute panic with 8-12% daily ranges versus normal 2-3%, term structure signaling crisis-level uncertainty
Historical Pattern: When volatility exceeds 85th percentile during Fed hawkish surprises at oversold technical levels, historical pattern shows either capitulation washout within 7-14 days if policy stance confirmed (1994, 2013 analogs with 25-35% total correction) or sharp V-recovery if Fed walks back hawkishness (2018 analog), current trajectory favors former until Fed speakers clarify stance
Outlook: Extreme volatility at 89th percentile following Fed policy shock typically persists 5-15 days before moderation toward 80th percentile begins, suggesting current extreme regime likely extends through March 26-31 as market digests hawkish Fed implications and tests capitulation lows
Trading Context: Extreme volatility at 89th percentile requires stops 18-25% below entry versus normal 4-6% with daily ranges now 8-12% versus typical 2-3%, making directional calls highly unreliable for momentum strategies but creating mean-reversion opportunities at capitulation extremes—breakdown below $67 becomes reliable continuation signal toward $60-64 while reversal above $74 with declining volatility signals bottom formation
Vol Risk/Opportunity: Extreme volatility regime at 89th percentile creates potential for 25-40% total correction from January $121.67 peak toward $64-70 zone representing 47-42% retracement before durable reversal, but also heightens probability of violent 15-25% counter-trend rallies lasting 2-5 days that trap late bears—asymmetry currently favors further 8-12% downside to $62-64 over next 1-2 weeks before capitulation bottom formation, then potential 20-30% recovery to $80-85 if Fed pivots or data weakens through April-May

── PRIMARY RISK ─────────────────────────────────
Further breakdown below $67 toward January flash crash lows near $64 if dollar sustains above DXY 107 and real yields hold above 2.0%, triggering cascading technical stops from remaining leveraged longs and forcing final capitulation from stubborn retail positioning at 85.9% long
Probability: MEDIUM

── PRIMARY OPPORTUNITY ──────────────────────────
Fed pivot signaling or softer-than-expected April employment data weakens dollar below DXY 105 and drives real yields back below 1.90%, creating V-shaped recovery toward $75-80 as washed-out institutional positioning and intact structural deficit enable sharp reversal
Timeframe: 2-4 weeks if macroeconomic data deteriorates forcing Fed reconsideration of hawkish stance by mid-April

── NEXT CATALYST ────────────────────────────────
Date: April 3, 2026
Event: March NFP employment report and any Fed speaker commentary clarifying whether March 18 hawkish shift represents sustained policy stance or tactical pause
Expected Impact: HIGH

═════════════════════════════════════════════════
Source: Macro Agent Desk (macroagentdesk.com)
═════════════════════════════════════════════════

── FULL ANALYSIS ────────────────────────────────
Silver is experiencing a brutal breakdown on March 22, 2026, trading at $69.66 after the Federal Reserve's March 18 hawkish hold triggered the worst precious metals selloff since 2011. The macro regime classification is RISK-OFF TRANSITIONAL—the VIX at 26.78 signals elevated fear, credit conditions are tightening, USD strength at DXY 107+ reflects safe-haven flight, yet paradoxically precious metals are being sold rather than bid as monetary policy dominates over safe-haven demand. This represents a regime where traditional correlations have broken: fear is rising but driving dollar strength rather than gold/silver strength because the Fed's hawkish surprise (dot plot now showing only ONE 2026 rate cut versus prior multi-cut expectations) has spiked real yields above the critical 2.0% threshold that historically crushes non-yielding assets. The critical market intelligence from post-input developments: silver has fallen 14-17% in the 48-72 hours since the March 18 FOMC, from the $81-84 range the discipline agents were analyzing to current $69.66, validating the Economic Agent's bearish warning but occurring AFTER most agent data was collected. This is not priced into the agent consensus—it IS the repricing event. From today's vantage point on March 22, the technical structure has catastrophically failed: the $70-72 support zone that held through February-March consolidation has broken decisively, with Friday's close at $67.81 (per bias history) followed by weekend stabilization near $69.66 representing dead-cat bounce behavior rather than reversal. The 50-day MA at $82.70 is now 18.7% overhead resistance, an insurmountable gap in current conditions. Multiple failed recovery attempts above $80 through early March have established a pattern of lower highs, and this week's breakdown confirms bearish momentum acceleration. The fundamental backdrop remains paradoxically constructive yet irrelevant: silver's sixth consecutive year of structural deficit (67M oz shortfall per Silver Institute February 2026 report) with industrial demand consuming record 59% of supply from solar, EV, and AI sectors represents genuine physical scarcity that would normally support prices above $75-80. China's export licensing restrictions controlling 60-70% of global supply operational since January 1 add weaponization dynamics not present in prior cycles. However, these medium-term structural positives cannot override the near-term monetary policy shock: 10Y TIPS real yields spiking above 2.0% (from 1.79% a week ago) creates a direct mathematical headwind for non-yielding silver, while DXY dollar strength to 107+ makes dollar-denominated commodities expensive for international buyers. The sentiment picture presents the classic late-stage capitulation setup but has not yet reached terminal extremes: Capital.com data showing 85.9% retail buyers versus 14.1% sellers as of March 16 (before this week's carnage) indicates the crowd remains stubbornly long despite now experiencing a 43% decline from January's $121.67 all-time high to current $69.66. This is textbook refusal to capitulate—retail continues buying dips even as institutional positioning (managed money net long at 24.6k contracts, near 2-year lows BEFORE this week) and ETF flows (SLV bleeding 9.32% AUM) signal smart money exodus. True capitulation occurs when retail positioning flips from 85% long to sub-60% long, which has not happened yet, suggesting further downside before a durable bottom. The volatility regime has re-entered EXTREME territory approaching 88th percentile levels from the January flash crash, with 30-day implied volatility likely exceeding 60% and daily price swings of 6-12% versus normal 2-3%. This creates unacceptable two-way risk for directional conviction: a 6% adverse move in 24 hours destroys any thesis regardless of medium-term merit. From a bias integrity perspective, last week's NO CALL at conviction 5 was MISSED as price fell -16.63% from Monday open $81.34 to Friday close $67.81, far exceeding even bearish expectations. This marks 1 consecutive miss, well below the 4-miss threshold requiring reset, but the magnitude of the move (-16.63% in one week) signals the market regime has shifted violently. The Bias Review Rule is not triggered (last week was NO CALL, breaking any directional streak). However, applying Rule 4 Thesis Health Score: reviewing the last 4 graded weeks, 2 of 4 moved contrary to any potential bullish bias (March 6 MISSED -11.95%, March 20 MISSED -16.63%), and the net 4-week move is -27.53% from $95.86 to $69.66, representing 4.75x the average weekly move of 5.79%—this would subtract 2 points from conviction on any bullish thesis. For a bearish thesis, recent price action CONFIRMS the direction, adding credibility. The prudent directional lean is BEARISH with TEMPERED conviction. Devil's advocate argument: the structural deficit entering its sixth year with permanent 59% industrial demand and China controlling 60-70% of tradeable supply suggests current $69.66 is oversold relative to fundamentals, and any Fed dovish pivot or dollar weakness could trigger violent short-covering rally back toward $80-85. However, the counter-argument prevails: monetary policy trumps fundamentals in crisis environments, and the Fed's March 18 hawkish hold with ONE-cut 2026 guidance represents a regime shift not a tactical pause until proven otherwise by subsequent data or Fed speaker walk-backs. Signal -2.5 reflects high conviction that further downside toward $64-67 is more probable than recovery above $75 over the next 5-10 trading days. Starting conviction 7 (strong bearish evidence across 4 of 6 disciplines) minus Rule 3 penalties: -1 for last call MISSED (March 20 NO CALL), -0 for macro regime (bearish bias ALIGNS with risk-off dollar-strength regime), -0 for volatility (extreme vol reduces conviction but bearish direction remains valid) = conviction 6. This represents moderate-high confidence that silver continues lower toward $64-67 support before any durable reversal, driven by Fed policy shock overwhelming structural fundamentals until either real yields retreat below 1.90% or retail capitulation reaches terminal extremes below 60% long positioning.