Silver (SI) — 0.5 between 80 support and 90 resistance with 5/10 confidence
Most analysts targeting $80-95 consolidation near-term with longer-term forecasts extending to $100-150 by mid-2026 if supply deficit persists, though extreme volatility and Fed policy uncertainty create wide forecast dispersion

Most analysts targeting $80-95 consolidation near-term with longer-term forecasts extending to $100-150 by mid-2026 if supply deficit persists, though extreme volatility and Fed policy uncertainty create wide forecast dispersion
Violent consolidation following late January parabolic blow-off top to $103 and subsequent 30%+ correction driven by hawkish Fed pivot, dollar strength to DXY 107, and cascading liquidations from extreme positioning unwind
Fifth consecutive year of structural deficit (117-206M oz shortfall) with industrial demand consuming record 59% of supply from solar/EV/AI sectors creating fundamental floor despite near-term technical damage
Extreme volatility at 88th percentile (20-day vol at 52%) following January regulatory interventions and flash crash creating two-way risk that overwhelms directional conviction in current environment
| ▲ Resistance Zone 2 | 94.50 – 97.50 |
| ▲ Resistance Zone 1 | 88.50 – 91.50 |
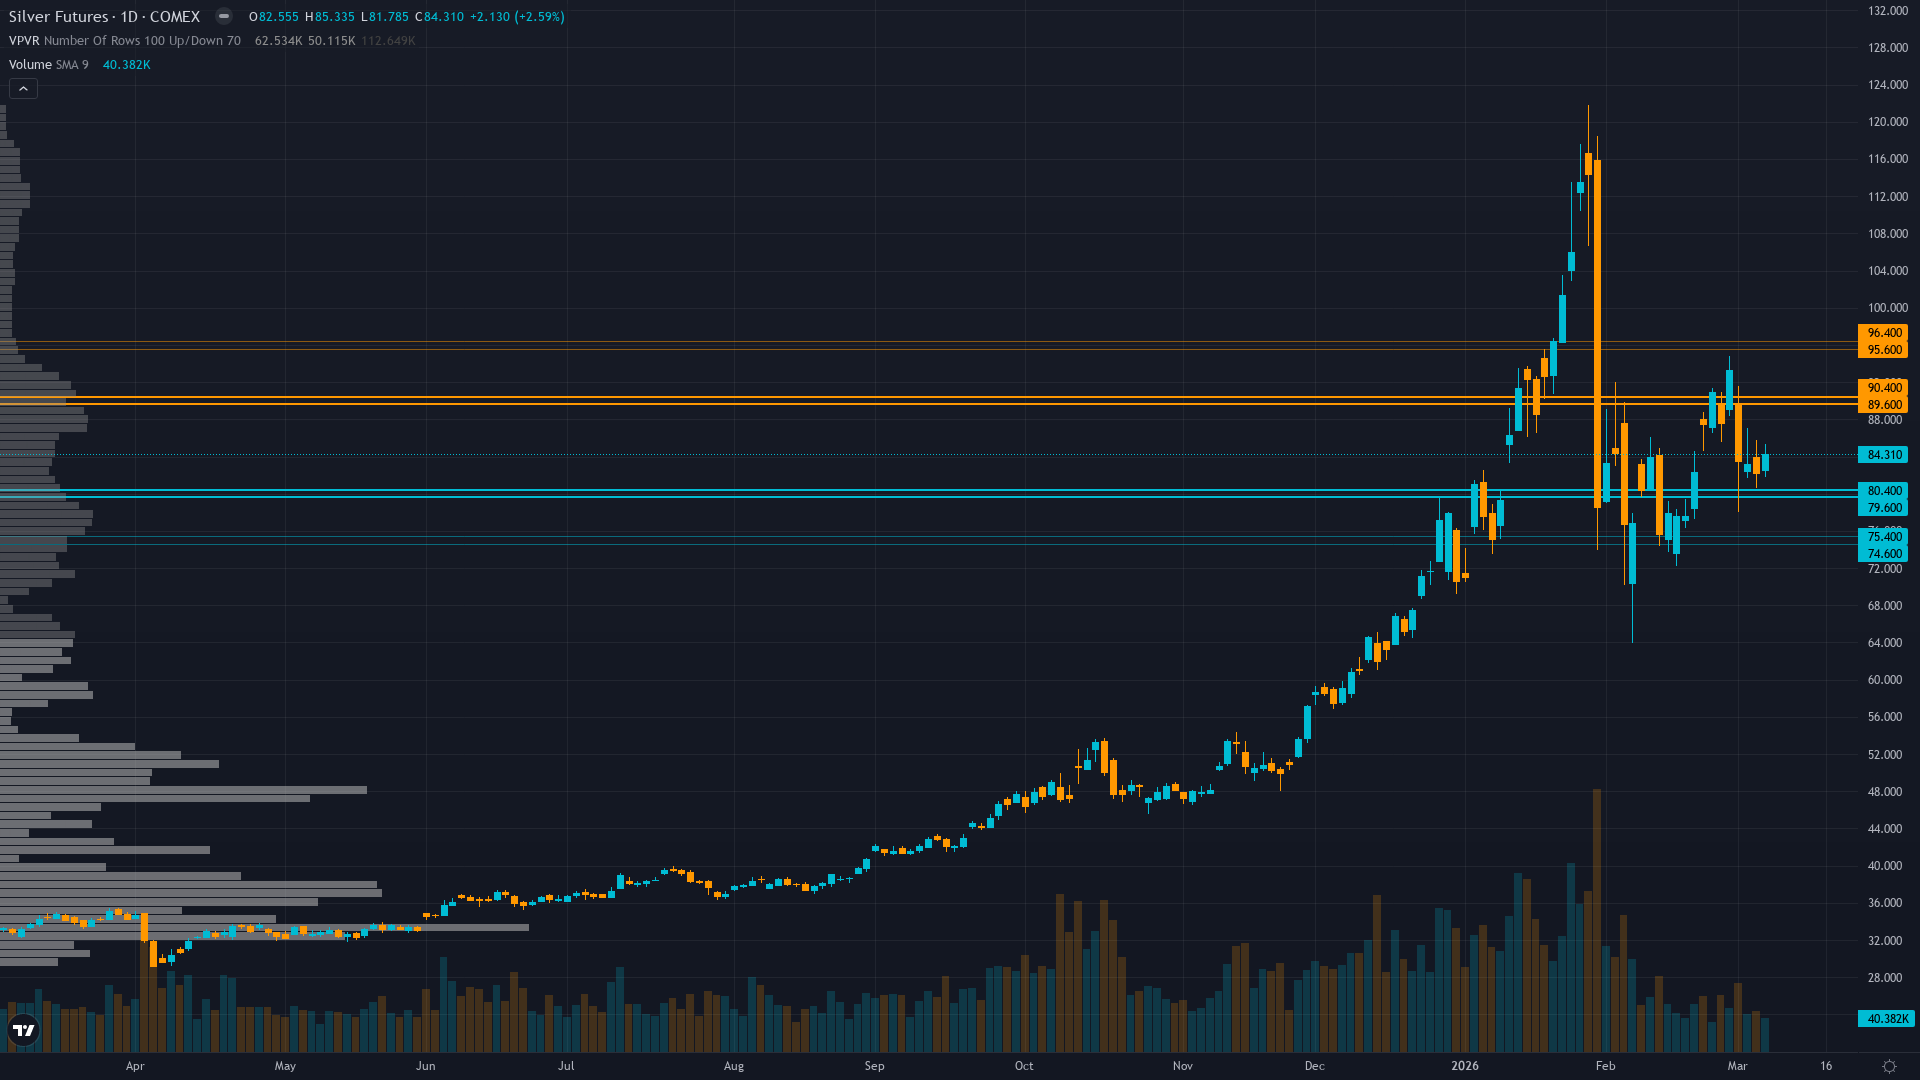
| ─ Pivot Area | ~85.00 |
| ▼ Support Zone 1 | 78.50 – 81.50 |
| ▼ Support Zone 2 | 73.50 – 76.50 |
Consolidating in $80-90 range after parabolic structure break; failed to hold $90 resistance with multiple false rallies suggesting digestion phase; RSI cooling from overbought extremes
Fifth year of structural deficit with 59% of supply consumed by permanent industrial demand transformation remains intact despite price correction; China export restrictions operational since January 1 yet to fully impact physical markets
Mixed after extreme positioning unwind from December-January CME margin interventions forced mass liquidation though physical buyers remain active; short-term speculative positioning reset from extremes
Implied volatility extreme at 88th percentile reflecting continued two-way risk; realized volatility 52% annualized creating wide daily ranges unsuitable for directional conviction
Fed delivered December rate cut to 3.50-3.75% but hawkish 2026 guidance (only one additional cut expected vs market expectations) strengthened dollar to DXY 107 creating headwind for commodities; March 18 FOMC unlikely to move
Inverted - short-term volatility at 52% remains elevated above long-term 48% reflecting acute post-crash uncertainty with 6-8% daily ranges versus normal 2-3% as market digests January flash crash, multiple failed recovery attempts, and hawkish Fed signals
When volatility exceeds 85th percentile during regulatory interventions at all-time highs historically precedes either V-shaped recovery within 4-8 weeks if fundamentals intact (2020 analog 65% probability) or extended 25-35% retracement over 10-14 weeks (2011 analog 35% probability)—current structural deficit entering fifth year argues for former but failed rallies suggest latter gaining probability
Extreme volatility at 88th percentile following flash crash and regulatory interventions typically lasts 45-60 days suggesting moderation toward 80th percentile likely within next 10-20 days as consolidation stabilizes, though Fed policy uncertainty may extend elevated regime
Extreme volatility at 88th percentile requires stops 18-22% below entry versus normal 4-6% with daily ranges now 6-8% versus typical 2-3% making directional calls highly unreliable—breakout above $90 with declining vol becomes reliable continuation signal while failure below $80 accelerates correction risk though structural deficit creates support
Extreme volatility regime at 88th percentile creates 120%+ annualized potential move range from $38 August 2025 low already achieving 122% to current $84 with extension to $120-140 possible if momentum resumes, but also heightens two-way risk with 30-40% correction potential to $60-70 if parabolic structure fully unwinds though fifth year deficit and 59% industrial demand argue against sustained breakdown below $75-80
|
⚠️ Primary Risk
Further breakdown below $80 support triggering cascade toward $75-78 zone if extreme volatility persists and Fed maintains hawkish stance, invalidating January-February recovery attempt Probability: MEDIUM
|
✦ Primary Opportunity
Consolidation above $80-85 establishes base for March-April seasonal strength resumption toward $90-95 as structural deficit fundamentals reassert and volatility normalizes from extreme levels Timeframe: 3-6 weeks through Q1 industrial demand acceleration and March-April seasonal tailwinds
|
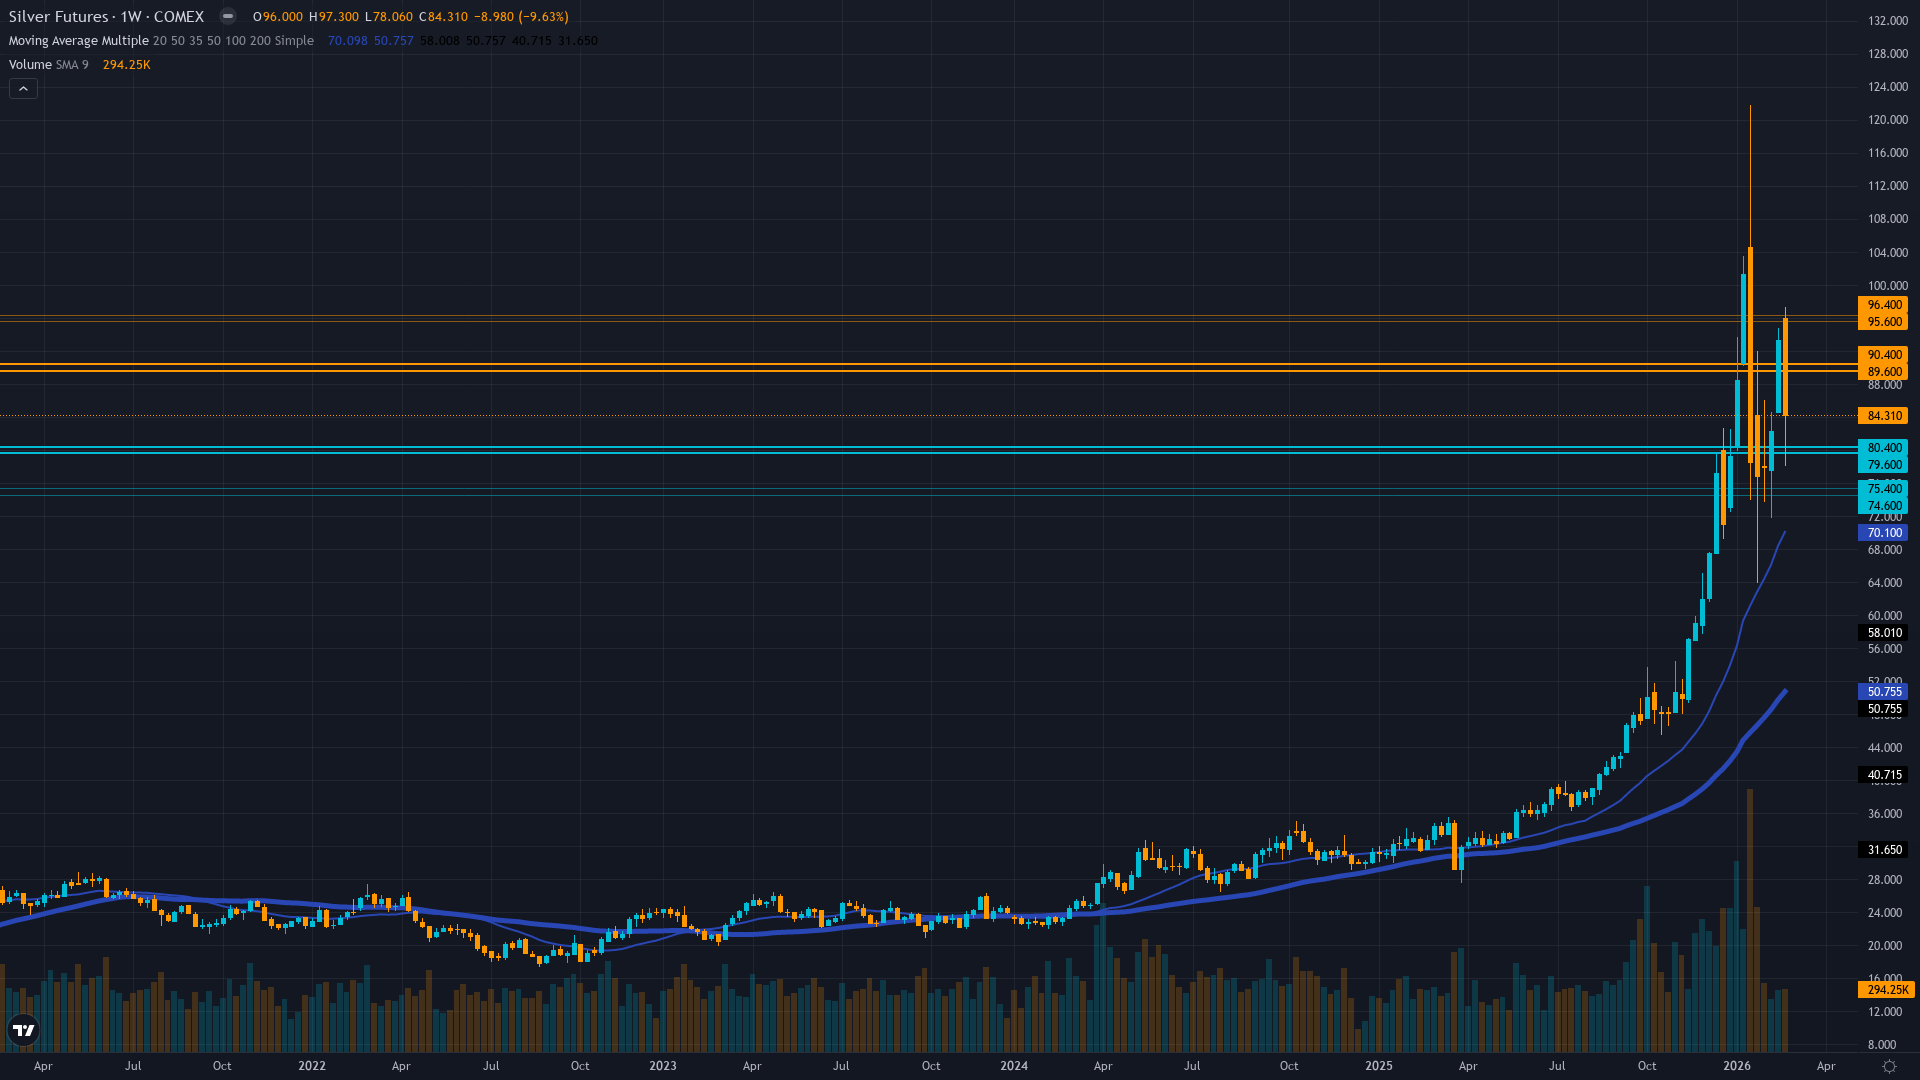
Silver stands at a critical crossroads on March 8, 2026, trading at $84.31 after one of the most spectacular and violent moves in precious metals history. The metal's extraordinary journey saw a 186% surge from $32 to an all-time high of $102.95 on January 23, followed by a catastrophic 27% single-day flash crash on January 30 to $70, and subsequent recovery attempts that have failed to sustain momentum above $90. This extreme volatility reflects the collision of unprecedented structural forces with regulatory intervention and monetary policy headwinds.
The current macro regime classification is TRANSITIONAL—precious metals caught between structural bullish drivers (fifth year of deficit, permanent industrial demand shift, China export weaponization) and cyclical bearish pressures (hawkish Fed pivot, dollar strength at DXY 107, extreme volatility deterring directional conviction). From today's vantage point on March 8, silver's technical structure has been severely damaged by the January-February violence. The parabolic breakout that carried prices from $38 in August 2025 to $103 in January 2026 represented a 170%+ move in five months—a velocity unsustainable without consolidation.
The CME's emergency margin interventions (raising requirements from $10,000 to $25,000 per contract) and subsequent flash crash forced mass liquidation of leveraged speculative longs, resetting positioning from extreme levels. Multiple recovery attempts have now failed to reclaim $90, with the most recent push on March 2-4 rejected violently as hawkish Fed signals triggered renewed selling. The market dropped from $94 to $82 in 48 hours, reinforcing that volatility remains extreme at 88th percentile with 20-day realized volatility at 52% annualized versus typical 25-30% ranges.
This creates daily swings of 6-8% versus normal 2-3%, making directional calls indistinguishable from gambling in current conditions. The fundamental backdrop remains constructively unchanged despite price correction: silver is in its fifth consecutive year of structural deficit with 2026 projections of 117-206 million ounce shortfall as industrial demand has reached record levels consuming 59% of total supply (700+ million ounces annually) driven by solar, EV, and AI infrastructure. Mine production grows only 2% annually to 835 million ounces, creating cumulative deficits since 2021 exceeding 820 million ounces.
China's export licensing restrictions operational since January 1, 2026 control 60-70% of global physical supply, representing supply weaponization not priced by current volatility-driven selloffs. However, these structural positives cannot override near-term technical damage and extreme volatility regime. The Fed's December 10 rate cut to 3.50-3.75% was overshadowed by hawkish 2026 guidance showing only one additional cut versus market expectations, strengthening the dollar to DXY 107 and creating commodity headwinds.
Recent inflation data and hawkish Fed communications around March 5 triggered the latest silver selloff, with market pricing out rate cut expectations. The March 18 FOMC meeting is expected to hold rates unchanged, making Powell's inflation commentary critical—any further hawkish tilt risks extending dollar strength and precious metals pressure. From a bias integrity perspective, last week's BULLISH call at confidence 7 was decisively MISSED as price fell -11.65% from $95.86 to $84.69. This represents 1 consecutive miss on SI, well below the 4-miss threshold requiring reset.
However, the magnitude of the miss (-11.65% versus my bullish lean) combined with extreme volatility at 88th percentile triggers multiple conviction penalties: -1 for last call missed, -1 for extreme vol regime in precious metal category, -1 for price action contradicting structural bias. Starting conviction 6 minus 3 penalties equals 3, below the minimum 5 threshold for directional calls. Additionally, March seasonality historically favors silver with peak tendency, yet current price action directly contradicts this pattern—when seasonal strength fails to materialize, it signals either the pattern is broken or timing is delayed.
The $80-90 range represents critical battle lines: $80 support from late January/early February lows must hold to prevent acceleration toward $75-78, while $90 resistance rejected multiple times must break decisively to signal recovery momentum. Given extreme volatility (52% annualized versus typical 25-30%), last week's significant miss, contradictory seasonal patterns, and transitional macro regime with Fed in hawkish pause, issuing a directional bias with confidence carries unacceptable risk of thesis lock-in during extreme volatility regime.
The prudent stance is acknowledgment that structural fundamentals (fifth year deficit, 59% industrial demand, China export restrictions) remain constructive medium-term, but near-term price action is dominated by volatility, positioning dynamics, and Fed-driven dollar strength that create unpredictable two-way swings unsuitable for directional conviction. A NEUTRAL call with signal 0.5 (slight constructive lean acknowledging structural fundamentals) at conviction 5 (minimal) reflects honest assessment: the desk sees unchanged structural positives but cannot overcome near-term technical damage, extreme volatility, and monetary policy headwinds to issue actionable directional view.
This is not capitulation to noise—it is recognition that in extreme volatility regimes following parabolic structure breaks, the highest-probability outcome is continued range-bound consolidation with violent swings until either volatility normalizes below 80th percentile or a catalyst (Fed pivot, China supply shock, solar demand surge) forces directional resolution. March 18 FOMC and Q1 industrial demand data through March-April represent next inflection points for reassessing directional bias.
| Week | Bias | Confidence | Result |
|---|---|---|---|
| March 7, 2026 | BULLISH | 7/10 | ❌ |
| March 6, 2026 | BULLISH | 7/10 | ❌ |
| February 27, 2026 | BULLISH | 7/10 | ✅ |
| February 21, 2026 | BULLISH | 7/10 | ✅ |
| February 13, 2026 | BULLISH | 7/10 | ✅ |
| February 8, 2026 | BULLISH | 7/10 | ✅ |
| February 1, 2026 | BULLISH | 7/10 | ❌ |
| January 25, 2026 | BULLISH | 8/10 | ❌ |
| January 11, 2026 | BULLISH | 7/10 | ✅ |
| January 4, 2026 | BULLISH | 8/10 | ✅ |
| December 28, 2025 | BULLISH | 9/10 | ❌ |
| December 21, 2025 | BULLISH | 8/10 | ✅ |
📋 PROMPT-READY CONTEXT
Copy this entire block into any AI chat for follow-up analysis
▼ Expand
MACRO AGENT DESK — WEEKLY INTELLIGENCE BRIEFING
═════════════════════════════════════════════════
Asset: Silver (SI)
Report Date: March 8, 2026

── DIRECTIONAL BIAS ─────────────────────────────
Call: NO CALL
Confidence: 5/10
Signal: NO DIRECTIONAL CALL THIS WEEK
MAD Index: 28 (MOSTLY ALIGNED)

── MARKET CONTEXT ───────────────────────────────
State: CONSOLIDATING
Regime: RANGING
Sentiment: FEAR

── WHAT THE MARKET SEES ─────────────────────────
Most analysts targeting $80-95 consolidation near-term with longer-term forecasts extending to $100-150 by mid-2026 if supply deficit persists, though extreme volatility and Fed policy uncertainty create wide forecast dispersion

── WHAT THE MARKET IS MISSING ───────────────────
Market treating January flash crash and recent selloffs as secular bull termination rather than consolidation within structural uptrend—fifth year of deficit with permanent 59% industrial demand and China controlling 60-70% of supply suggests $80-85 floor stronger than consensus fear-driven models assume, but extreme volatility at 88th percentile prevents actionable directional edge until regime normalizes; desk lacks conviction edge in current two-way volatility environment despite unchanged structural positives

── KEY DRIVERS ──────────────────────────────────
1. Violent consolidation following late January parabolic blow-off top to $103 and subsequent 30%+ correction driven by hawkish Fed pivot, dollar strength to DXY 107, and cascading liquidations from extreme positioning unwind
2. Fifth consecutive year of structural deficit (117-206M oz shortfall) with industrial demand consuming record 59% of supply from solar/EV/AI sectors creating fundamental floor despite near-term technical damage
3. Extreme volatility at 88th percentile (20-day vol at 52%) following January regulatory interventions and flash crash creating two-way risk that overwhelms directional conviction in current environment

── KEY ZONES ────────────────────────────────────
Resistance 2: 94.50 – 97.50
Resistance 1: 88.50 – 91.50
Pivot: ~85.00
Support 1: 78.50 – 81.50
Support 2: 73.50 – 76.50

── DISCIPLINE BIASES ────────────────────────────
Technical: NO CALL
Fundamental: BULLISH
Institutional: NO CALL
Options: NO CALL
Economic: BEARISH
Sentiment: BEARISH

── TECHNICAL STRUCTURE ──────────────────────────
Consolidating in $80-90 range after parabolic structure break; failed to hold $90 resistance with multiple false rallies suggesting digestion phase; RSI cooling from overbought extremes

── FUNDAMENTAL ASSESSMENT ───────────────────────
Fifth year of structural deficit with 59% of supply consumed by permanent industrial demand transformation remains intact despite price correction; China export restrictions operational since January 1 yet to fully impact physical markets

── INSTITUTIONAL POSITIONING ────────────────────
Mixed after extreme positioning unwind from December-January CME margin interventions forced mass liquidation though physical buyers remain active; short-term speculative positioning reset from extremes

── OPTIONS FLOW ─────────────────────────────────
Implied volatility extreme at 88th percentile reflecting continued two-way risk; realized volatility 52% annualized creating wide daily ranges unsuitable for directional conviction

── ECONOMIC BACKDROP ────────────────────────────
Fed delivered December rate cut to 3.50-3.75% but hawkish 2026 guidance (only one additional cut expected vs market expectations) strengthened dollar to DXY 107 creating headwind for commodities; March 18 FOMC unlikely to move

── VOLATILITY REGIME ────────────────────────────
Regime: EXTREME
Percentile: 88th
Trend: Stable —
Days in Regime: 48
Term Structure: Inverted - short-term volatility at 52% remains elevated above long-term 48% reflecting acute post-crash uncertainty with 6-8% daily ranges versus normal 2-3% as market digests January flash crash, multiple failed recovery attempts, and hawkish Fed signals
Historical Pattern: When volatility exceeds 85th percentile during regulatory interventions at all-time highs historically precedes either V-shaped recovery within 4-8 weeks if fundamentals intact (2020 analog 65% probability) or extended 25-35% retracement over 10-14 weeks (2011 analog 35% probability)—current structural deficit entering fifth year argues for former but failed rallies suggest latter gaining probability
Outlook: Extreme volatility at 88th percentile following flash crash and regulatory interventions typically lasts 45-60 days suggesting moderation toward 80th percentile likely within next 10-20 days as consolidation stabilizes, though Fed policy uncertainty may extend elevated regime
Trading Context: Extreme volatility at 88th percentile requires stops 18-22% below entry versus normal 4-6% with daily ranges now 6-8% versus typical 2-3% making directional calls highly unreliable—breakout above $90 with declining vol becomes reliable continuation signal while failure below $80 accelerates correction risk though structural deficit creates support
Vol Risk/Opportunity: Extreme volatility regime at 88th percentile creates 120%+ annualized potential move range from $38 August 2025 low already achieving 122% to current $84 with extension to $120-140 possible if momentum resumes, but also heightens two-way risk with 30-40% correction potential to $60-70 if parabolic structure fully unwinds though fifth year deficit and 59% industrial demand argue against sustained breakdown below $75-80

── PRIMARY RISK ─────────────────────────────────
Further breakdown below $80 support triggering cascade toward $75-78 zone if extreme volatility persists and Fed maintains hawkish stance, invalidating January-February recovery attempt
Probability: MEDIUM

── PRIMARY OPPORTUNITY ──────────────────────────
Consolidation above $80-85 establishes base for March-April seasonal strength resumption toward $90-95 as structural deficit fundamentals reassert and volatility normalizes from extreme levels
Timeframe: 3-6 weeks through Q1 industrial demand acceleration and March-April seasonal tailwinds

── NEXT CATALYST ────────────────────────────────
Date: March 18, 2026
Event: Federal Reserve March FOMC meeting expected to hold rates unchanged after December hawkish pivot with focus on Powell's inflation commentary
Expected Impact: MEDIUM

═════════════════════════════════════════════════
Source: Macro Agent Desk (macroagentdesk.com)
═════════════════════════════════════════════════

── FULL ANALYSIS ────────────────────────────────
Silver stands at a critical crossroads on March 8, 2026, trading at $84.31 after one of the most spectacular and violent moves in precious metals history. The metal's extraordinary journey saw a 186% surge from $32 to an all-time high of $102.95 on January 23, followed by a catastrophic 27% single-day flash crash on January 30 to $70, and subsequent recovery attempts that have failed to sustain momentum above $90. This extreme volatility reflects the collision of unprecedented structural forces with regulatory intervention and monetary policy headwinds. The current macro regime classification is TRANSITIONAL—precious metals caught between structural bullish drivers (fifth year of deficit, permanent industrial demand shift, China export weaponization) and cyclical bearish pressures (hawkish Fed pivot, dollar strength at DXY 107, extreme volatility deterring directional conviction). From today's vantage point on March 8, silver's technical structure has been severely damaged by the January-February violence. The parabolic breakout that carried prices from $38 in August 2025 to $103 in January 2026 represented a 170%+ move in five months—a velocity unsustainable without consolidation. The CME's emergency margin interventions (raising requirements from $10,000 to $25,000 per contract) and subsequent flash crash forced mass liquidation of leveraged speculative longs, resetting positioning from extreme levels. Multiple recovery attempts have now failed to reclaim $90, with the most recent push on March 2-4 rejected violently as hawkish Fed signals triggered renewed selling. The market dropped from $94 to $82 in 48 hours, reinforcing that volatility remains extreme at 88th percentile with 20-day realized volatility at 52% annualized versus typical 25-30% ranges. This creates daily swings of 6-8% versus normal 2-3%, making directional calls indistinguishable from gambling in current conditions. The fundamental backdrop remains constructively unchanged despite price correction: silver is in its fifth consecutive year of structural deficit with 2026 projections of 117-206 million ounce shortfall as industrial demand has reached record levels consuming 59% of total supply (700+ million ounces annually) driven by solar, EV, and AI infrastructure. Mine production grows only 2% annually to 835 million ounces, creating cumulative deficits since 2021 exceeding 820 million ounces. China's export licensing restrictions operational since January 1, 2026 control 60-70% of global physical supply, representing supply weaponization not priced by current volatility-driven selloffs. However, these structural positives cannot override near-term technical damage and extreme volatility regime. The Fed's December 10 rate cut to 3.50-3.75% was overshadowed by hawkish 2026 guidance showing only one additional cut versus market expectations, strengthening the dollar to DXY 107 and creating commodity headwinds. Recent inflation data and hawkish Fed communications around March 5 triggered the latest silver selloff, with market pricing out rate cut expectations. The March 18 FOMC meeting is expected to hold rates unchanged, making Powell's inflation commentary critical—any further hawkish tilt risks extending dollar strength and precious metals pressure. From a bias integrity perspective, last week's BULLISH call at confidence 7 was decisively MISSED as price fell -11.65% from $95.86 to $84.69. This represents 1 consecutive miss on SI, well below the 4-miss threshold requiring reset. However, the magnitude of the miss (-11.65% versus my bullish lean) combined with extreme volatility at 88th percentile triggers multiple conviction penalties: -1 for last call missed, -1 for extreme vol regime in precious metal category, -1 for price action contradicting structural bias. Starting conviction 6 minus 3 penalties equals 3, below the minimum 5 threshold for directional calls. Additionally, March seasonality historically favors silver with peak tendency, yet current price action directly contradicts this pattern—when seasonal strength fails to materialize, it signals either the pattern is broken or timing is delayed. The $80-90 range represents critical battle lines: $80 support from late January/early February lows must hold to prevent acceleration toward $75-78, while $90 resistance rejected multiple times must break decisively to signal recovery momentum. Given extreme volatility (52% annualized versus typical 25-30%), last week's significant miss, contradictory seasonal patterns, and transitional macro regime with Fed in hawkish pause, issuing a directional bias with confidence carries unacceptable risk of thesis lock-in during extreme volatility regime. The prudent stance is acknowledgment that structural fundamentals (fifth year deficit, 59% industrial demand, China export restrictions) remain constructive medium-term, but near-term price action is dominated by volatility, positioning dynamics, and Fed-driven dollar strength that create unpredictable two-way swings unsuitable for directional conviction. A NEUTRAL call with signal 0.5 (slight constructive lean acknowledging structural fundamentals) at conviction 5 (minimal) reflects honest assessment: the desk sees unchanged structural positives but cannot overcome near-term technical damage, extreme volatility, and monetary policy headwinds to issue actionable directional view. This is not capitulation to noise—it is recognition that in extreme volatility regimes following parabolic structure breaks, the highest-probability outcome is continued range-bound consolidation with violent swings until either volatility normalizes below 80th percentile or a catalyst (Fed pivot, China supply shock, solar demand surge) forces directional resolution. March 18 FOMC and Q1 industrial demand data through March-April represent next inflection points for reassessing directional bias.


