Russell 2000 Forecast This Week — Outlook, Drivers & Key Levels
This week's Russell 2000 outlook: key drivers, volatility context, risk-opportunity assessment and the week ahead.

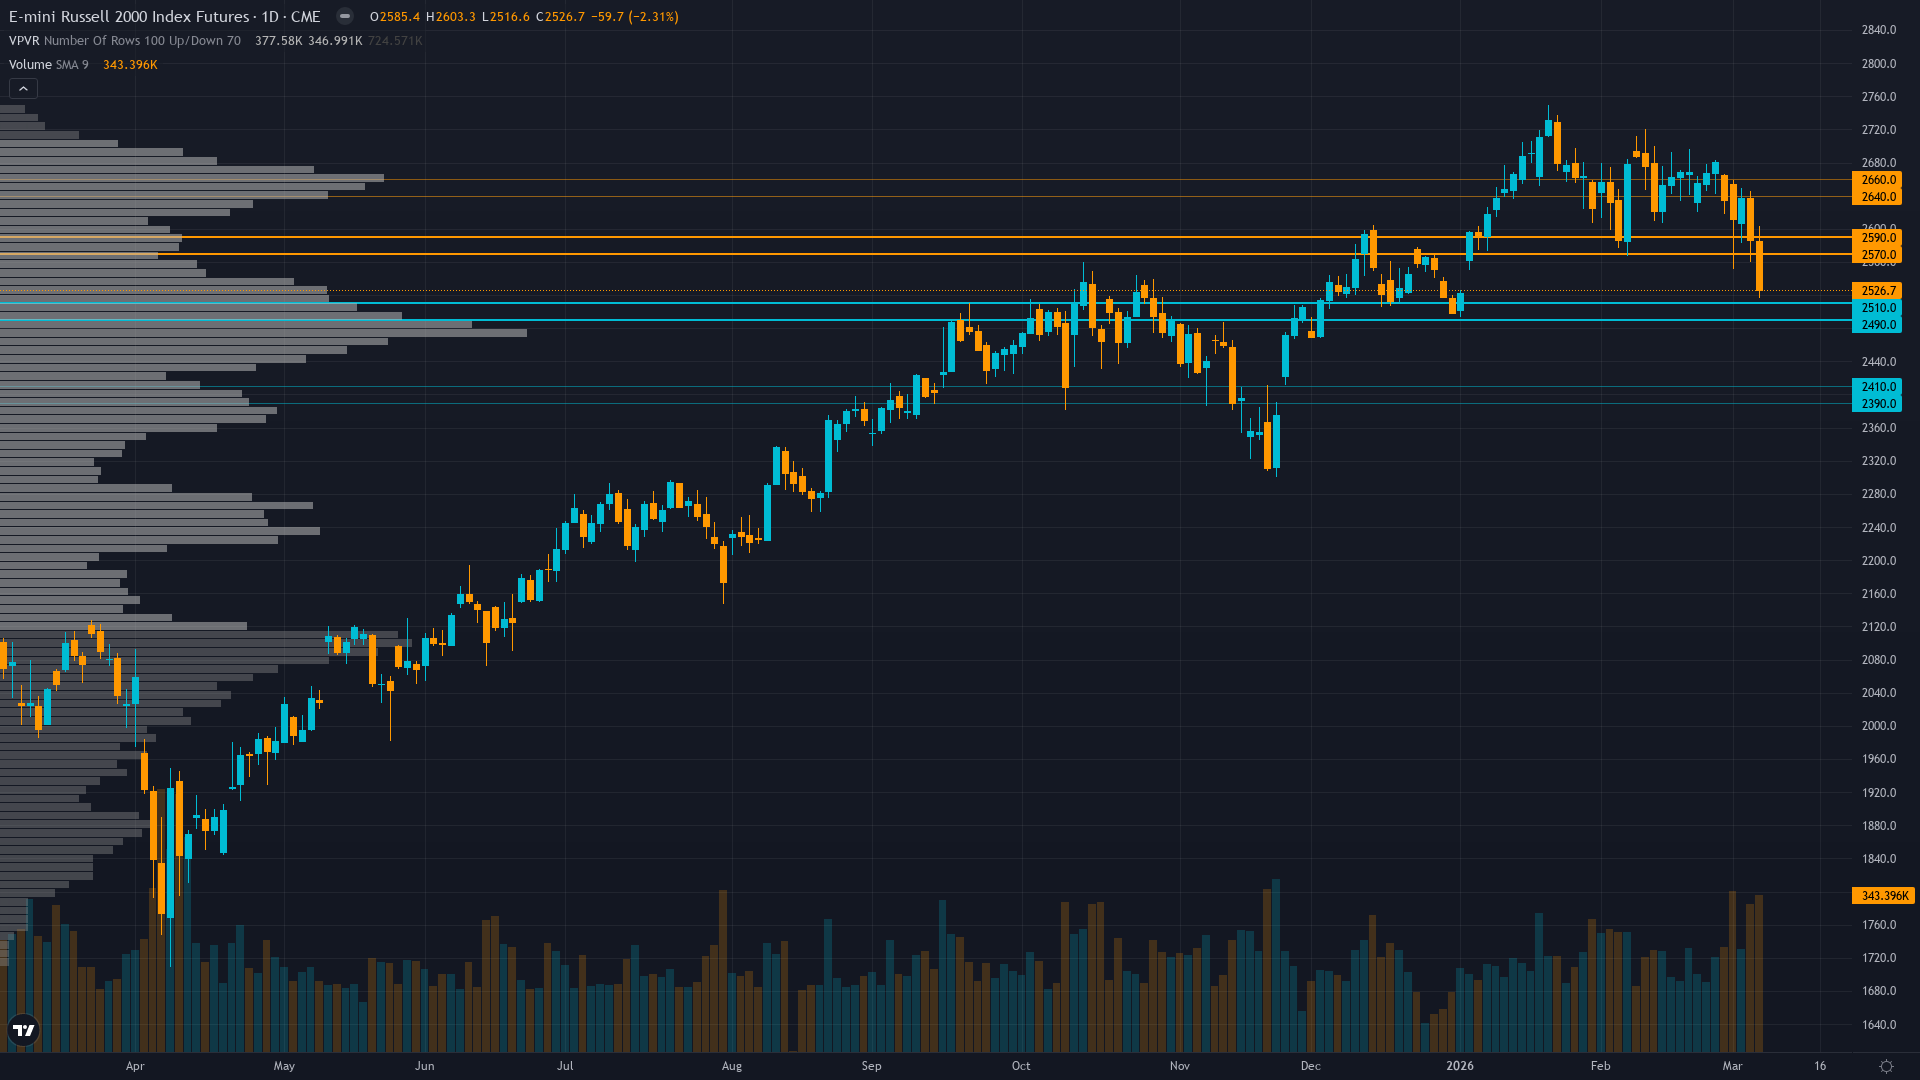
This Week's Starting Point
Russell 2000 is trading at 2524, down 3.35% as selling pressure weighs on price. Russell 2000 futures is in a breaking down market state, requiring careful assessment of current conditions.
Small-caps under pressure from geopolitical shocks and Fed uncertainty but retaining structural appeal from valuation discount and earnings growth outlook once volatility settles
Bull & Bear Case
Primary risk: Continued geopolitical escalation (Iran conflict) combining with Fed confirming extended pause or hawkish tilt at March 19 FOMC triggering 5-8% additional correction toward 2340-2400 major support (Probability: high)
Primary opportunity: Tactical bounce toward 2580-2600 if geopolitical tensions de-escalate and March FOMC provides dovish surprise, though upside capped until breakout thesis re-validates above 2650 (Timeframe: 1-2 weeks into March FOMC meeting)
This week's edge: Bias review triggered after 4 consecutive BULLISH weeks with 2 consecutive misses and contrary price action—thesis empirically failing. Market severely underpricing geopolitical and Fed hawkish risks that desk overweighted January seasonal/technical factors.
This Week's Catalysts & Drivers
Primary driver: Geopolitical shock (Iran conflict) combining with tariff uncertainty triggering risk-off selloff that disproportionately hit rate-sensitive small-caps 7.7% below January 22 all-time high
Secondary factor: Fed March 19 FOMC uncertainty after February minutes revealed 'sharp divergence' with some members considering rate HIKES if inflation persists, removing easing catalyst
Additional influence: Technical breakdown with price violating 2,565 support and RVX volatility spiking to 25.91 from sub-20 levels, signaling investor capitulation after failed January breakout
Economic backdrop: Fed funds at 3.5-3.75% after January 29 pause, February FOMC minutes showed policy divergence with some members eyeing HIKES, Iran conflict spiking oil to $90/barrel creating stagflation concerns
Fundamental assessment: Small-caps retain 18% valuation discount to S&P 500 with 18-22% earnings growth outlook but rate sensitivity becomes liability as Fed hawkish pivot removes easing catalyst
Technical Picture
Decisive breakdown below 2565 support with Strong Sell technical signals, 7.7% below January 22 ATH of 2735, trend integrity broken
At 3/10, trend strength is subdued, suggesting the market lacks a clear directional mandate.
Risk Environment
With vol at the 58th percentile over 90 days, RTY futures is in a measured regime that doesn't require unusual adjustments. Volatility is expanding, with realised vol rising across timeframes. This typically signals increasing uncertainty and wider daily ranges ahead.
Elevated volatility regime requires wider risk management with 4-5% stops below 2,400 support, expect 60-90 point daily ranges versus 40-60 point ranges during normal regime, breakout failure combined with vol expansion suggests highly directional environment favoring trend-following rather than mean-reversion
Seasonal Context
Historical seasonal patterns for small-cap futures offer no strong directional signal in March 2026 (52% win rate). Quarter-end rebalancing can create volatility.
Week Ahead Outlook
The next major catalyst is FOMC Meeting following January pause and hawkish February minutes revelation on Thursday 19 March — a high-impact event that could materially shift the directional picture.
For Russell 2000, the balance between existing momentum and scheduled risk events sets the stage for the week ahead.
This analysis covers one dimension. Our full weekly report combines six specialist agents into a single actionable briefing with directional bias, key levels, and risk-opportunity matrix.
Start Free — Get the Market of the WeekFree weekly report · No credit card · Upgrade anytime


